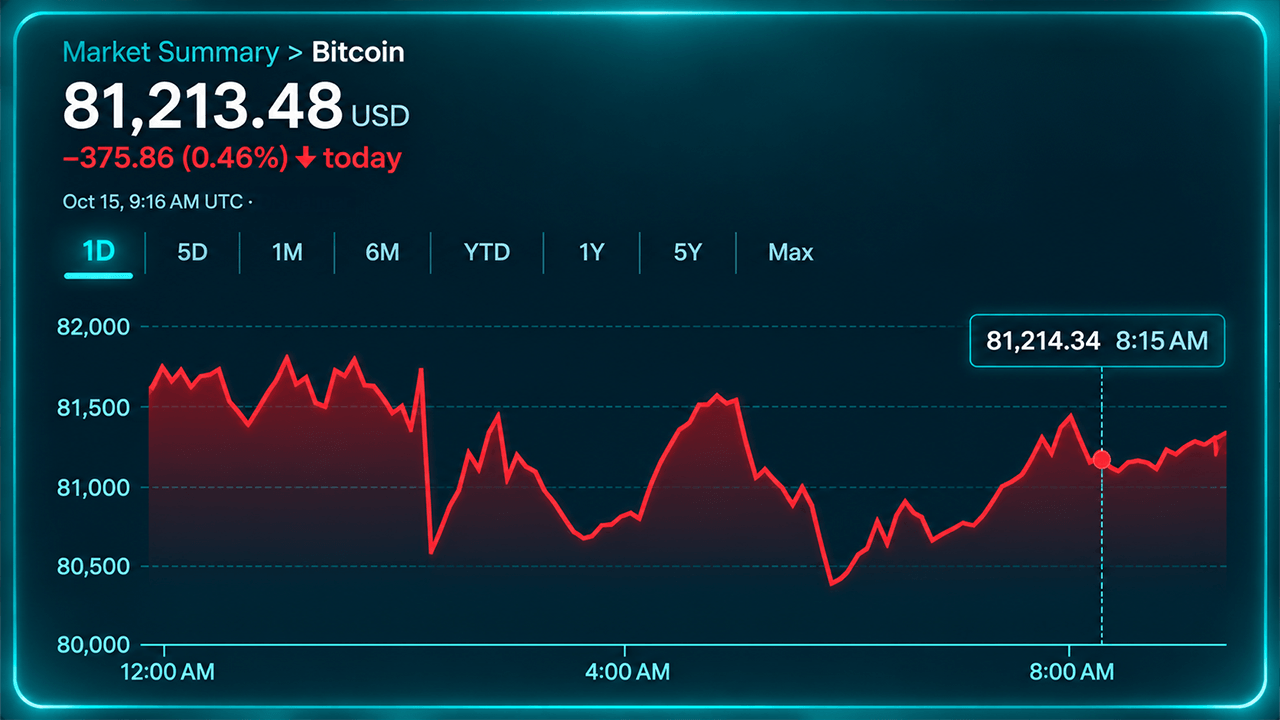
Bitcoin's price hovered near $81,200 on October 15, 2026, after falling to $80,154, with the $80,000 threshold drawing traders' attention. The cryptocurrency commanded a $1.633 trillion market capitalization and $41.22 billion in 24-hour volume.
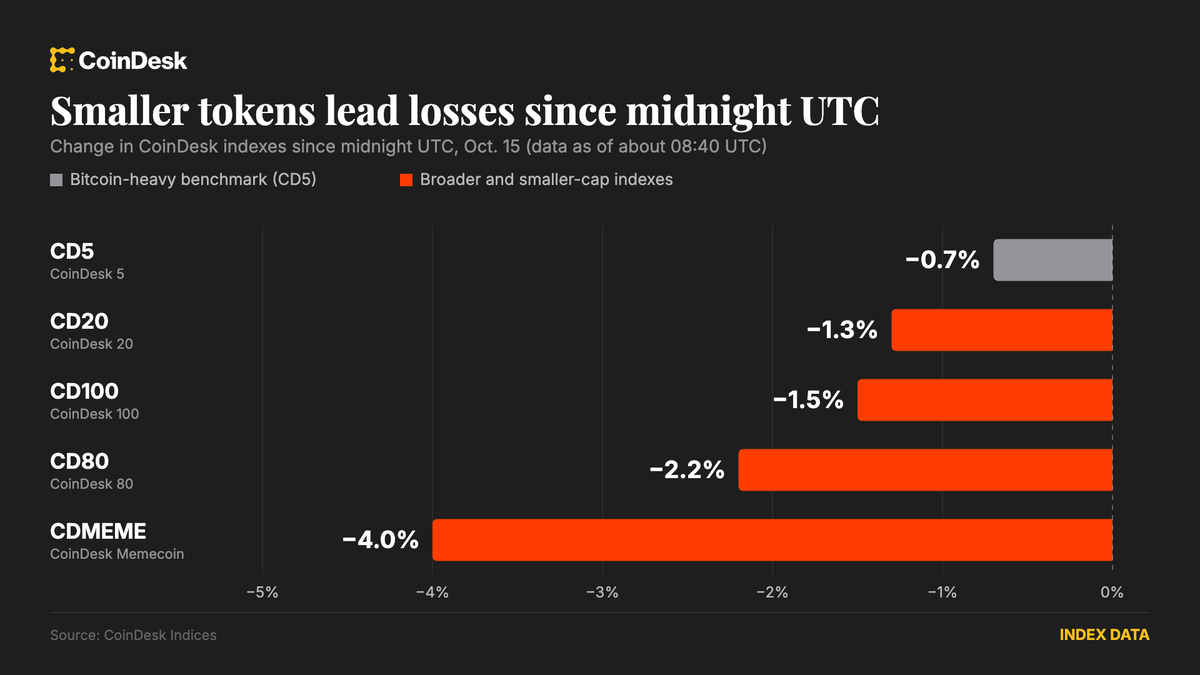
The decline coincided with significant losses across Asian equity markets. South Korea's Kospi dropped roughly 7.6% to 8%, triggering circuit breakers, while Japan's Nikkei 225 fell nearly 5%. Taiwan's Taiex declined approximately 3%, and China's Shanghai Composite slipped around 1.5%. European shares also faced selling pressure, with the Stoxx 600 down approximately 0.35% and its technology sector losing 3.2%.
Technical Analysis
Bitcoin's one-hour chart showed a retreat from approximately $84,044 to a low near $80,154, followed by consolidation around $81,200. Immediate resistance was concentrated between $81,500 and $81,800, with traders monitoring whether another rejection would push the price toward $80,500 and the $80,150 support area.
The four-hour chart displayed lower highs and repeated failures to sustain advances above $83,500, indicating persistent selling interest. Reclaiming $82,000 would represent an initial recovery, though $82,500 remained the more significant threshold.
On the daily chart, Bitcoin had surrendered much of its previous advance from $74,913 to $87,374. A daily close below $80,000 would expose $79,000 and potentially $78,000, while a sustained recovery above $81,800 would improve the near-term outlook.
Indicators and Moving Averages
Bitcoin's oscillators delivered mixed signals. The relative strength index (RSI) stood at 46, Stochastic registered 25, and the commodity channel index (CCI) read minus 163. The average directional index (ADX) sat at 26, while momentum registered minus 4,516 and moving average convergence divergence (MACD) remained negative at 266.
Short-term moving averages painted a bearish picture. Bitcoin traded beneath the 10-period exponential moving average at $82,635 and the 20-period exponential moving average at $82,801. Longer-term indicators remained more constructive, with the 50-period exponential moving average at $80,297 and the 200-period simple moving average at $72,282.