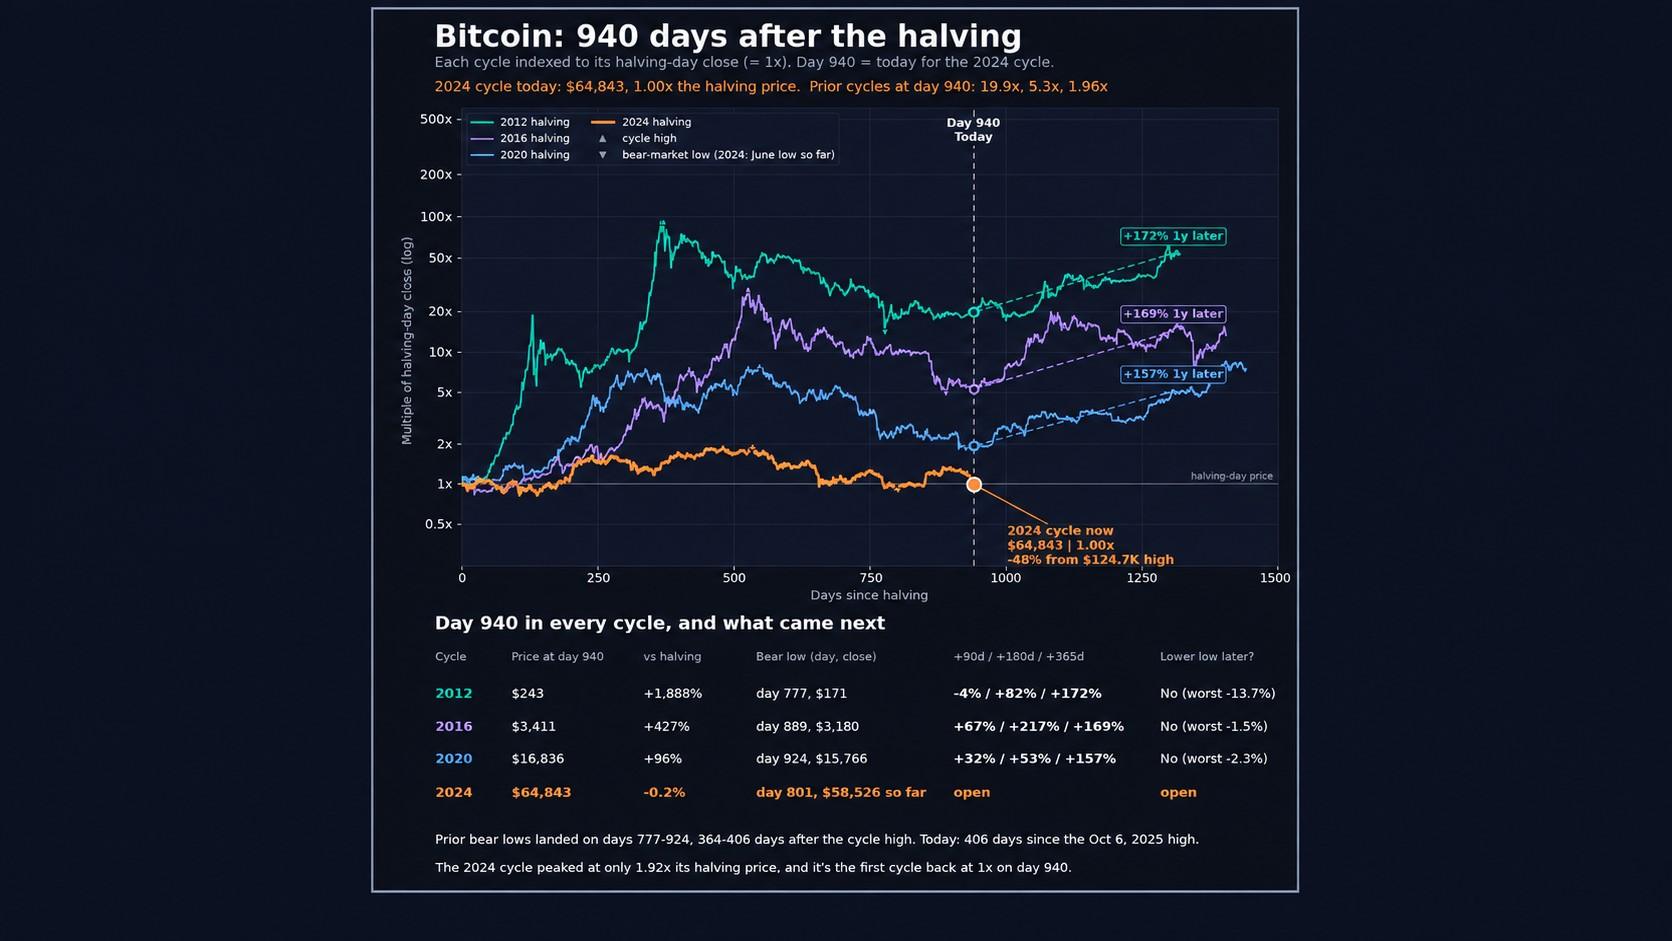
Bitcoin's price has essentially round-tripped to where it stood on its fourth halving day, April 20, 2024, marking an unusual milestone in the asset's history. On the halving date, BTC closed at $64,940. On November 17, 2026—940 days later—the asset traded near $64,600, leaving it virtually flat over the two-and-a-half-year period.
This flat performance stands in stark contrast to previous halving cycles. By day 940 after the 2012 halving, bitcoin had risen 1,888%. The 2016 cycle was up 427% at the same point, and the 2020 cycle had gained 96%. Each of those cycles continued to climb another 157% to 172% over the following year.
Technical Levels and Analyst Views
The flat result follows a steep decline from Bitcoin's October 2025 peak. BTC reached an intraday record of $126,199 on October 6, 2025, leaving today's price approximately 49% below that high. The latest leg down pushed bitcoin 14% lower in one week and briefly below $62,000.
Analysts are divided on whether the market has found a bottom. Some point to technical support levels, particularly the 200-week simple moving average, which currently sits near $68,000. Weekly closes above $69,700 would reclaim this key trend line. Support levels to watch include $63,000 and $60,000, with a liquidation cluster identified near $60,000.
Historical data from previous cycles shows that bear-market lows typically occurred 364 to 406 days after cycle peaks, with no lower lows thereafter. Monday marked day 406 since the October 2025 top, placing the current cycle at the outer edge of this historical window.
Structural Factors and Market Sentiment
Not all analysts see a bottom forming. Market maker Wintermute reported that the bear market remains in place after liquidations and a 12.7% weekly decline. The firm noted that recent rebounds appeared driven by short covering rather than fresh capital inflows. The Crypto Fear & Greed Index is deep in fear territory, reflecting extreme negative sentiment.
Structural changes in the Bitcoin market may also affect historical comparisons. Each successive halving now removes a smaller share of new supply, and exchange-traded funds and corporate treasuries play a far larger role in price discovery than in previous cycles. These factors could weaken the four-year cyclical pattern that prior halvings followed.
Large Bitcoin holders present a mixed picture. Whale-level investors are sitting on record $8 billion in losses without selling, suggesting conviction, but this conviction has not yet translated into fresh buying pressure.