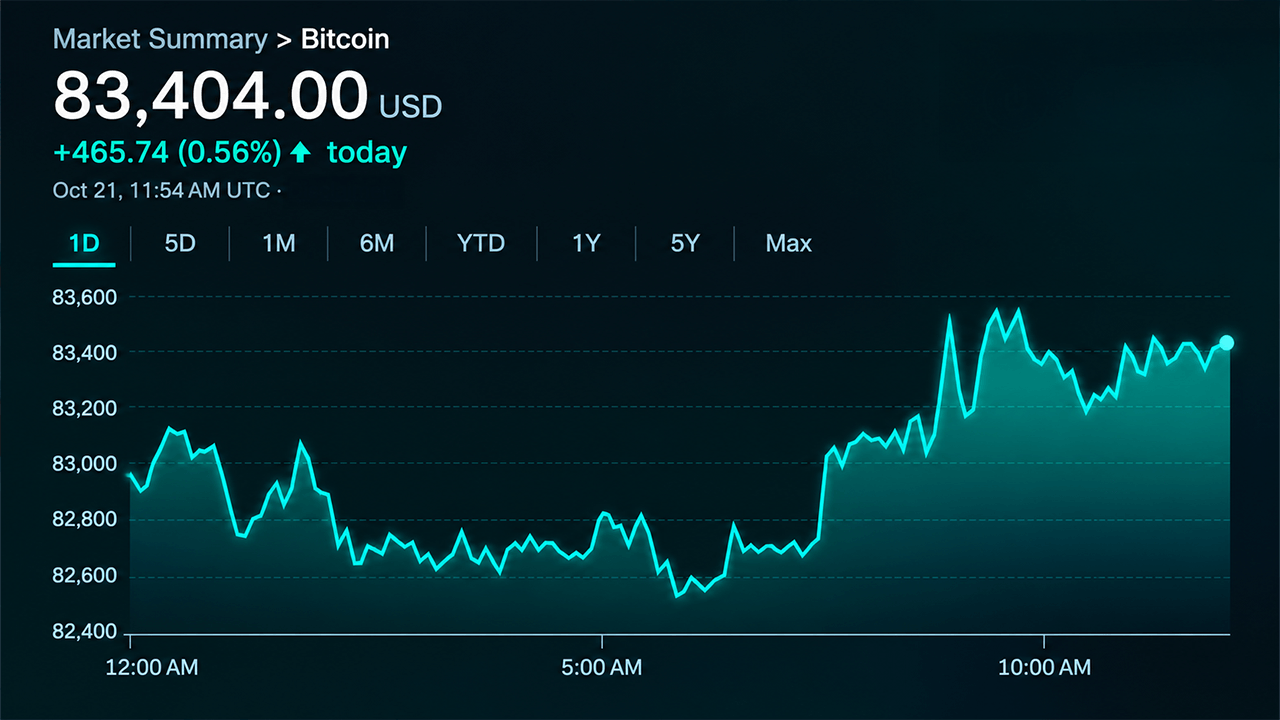
Bitcoin is experiencing one of its quietest stretches in years, and that calm is making traders nervous. Volatility in the largest cryptocurrency is closing in on its 2026 lows, a trend K33 Research attributes to thin trading activity ahead of a cluster of potential market catalysts.
Quietest Bitcoin in a While
As of mid-to-late October 2026, Bitcoin was trading between $82,000 and $83,000. Its 7-day realized volatility sits near multi-year lows, with Bollinger Bands spanning approximately 6.5% of the price—among the tightest in the past two and a half years.
The Deribit DVOL, a gauge of 30-day implied volatility derived from options prices, was around 37, ranking among the lowest levels of the past five years. Near-term at-the-money implied volatility hovers in the low-to-mid 30s percentage range heading into the Federal Reserve meeting.
Weak Volumes and a Stubborn Ceiling
K33 Research pointed to stagnant trading activity as the main driver behind the lull. The firm also noted a period of consolidation earlier in the month: Bitcoin was capped near its yearly open of $87,500 for 14 straight days in early October. Since then, the price has drifted lower into the low $80,000s.
Two Catalysts on the Calendar
The first event is the Federal Reserve’s FOMC meeting on October 28. September CPI data showed inflation at 3.7% year over year, slightly above the 3.6% economists expected.
The second event lands two days later: a Bitcoin options expiry worth roughly $12 billion is set for October 30.
Why the Market Is Calmer Than It Used to Be
Part of the volatility decline appears structural rather than seasonal. Institutional participation through US spot Bitcoin ETFs and corporate treasury holdings has changed who owns the asset, contributing to a structural reduction in volatility compared to historical cycles. Annual realized volatility settled between 40% and 47% in 2026, well below historical averages that frequently exceeded 80%.
What This Means for Traders and Investors
Similar low-volatility conditions in the past have preceded 30% price swings in either direction within months. Implied volatility around 37 means options are relatively cheap, while the calendar holds two events capable of jolting the market.
The $87,500 yearly open remains the level to watch on the upside. Reclaiming it after two weeks of rejection would signal that buyers have regained control.
Following a 3.7% CPI print, any signal about the path of rates could reprice risk assets broadly. Then comes the October 30 expiry, where positioning around popular strike prices could add friction or fuel to whatever move the Fed sets in motion.