Bitcoin's one-month realized volatility has dropped to historically low levels, according to a statistical analysis published by analytics firm Glassnode on X. At the time of the report, bitcoin was trading at $78,449.49 after slipping below the $79,000 mark following an unsuccessful attempt to sustain a level above $80,000.
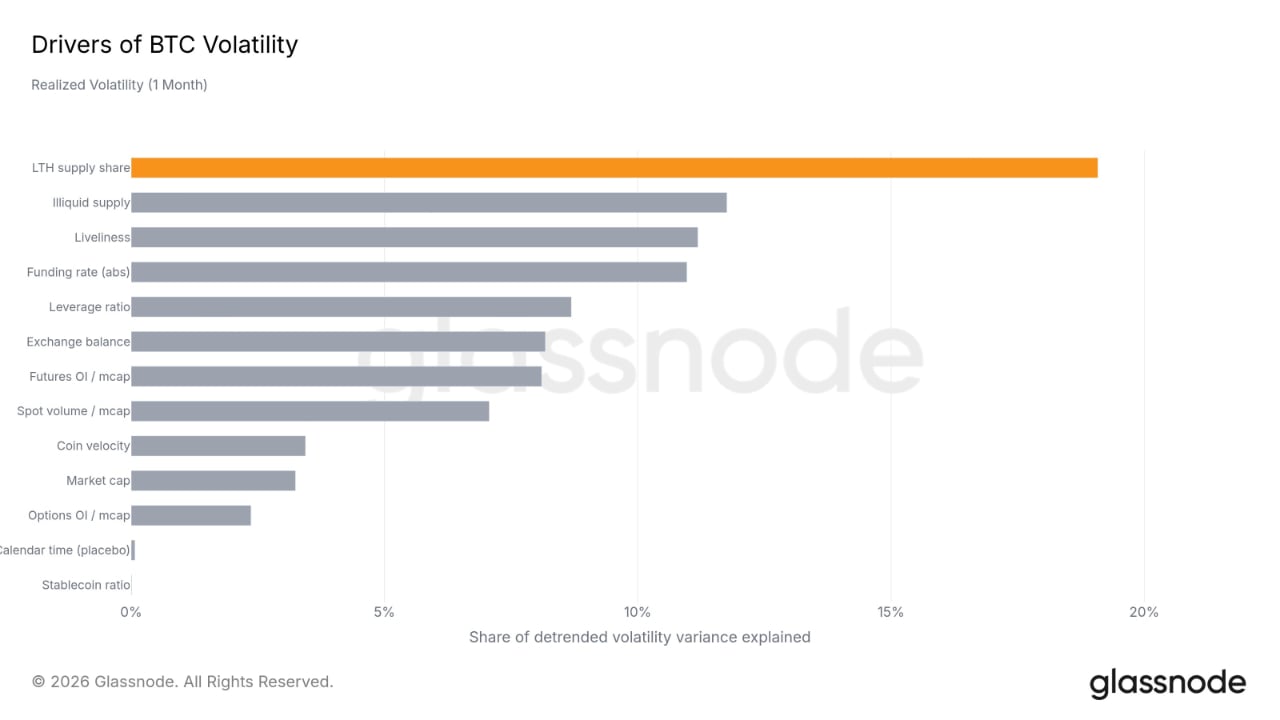
To understand the drivers behind these short-term price fluctuations, Glassnode examined 13 variables against detrended volatility variance, a method that removes longer-term statistical direction to highlight shorter-term relationships. The analysis identified long-term holder supply as the leading explanatory variable, accounting for nearly 19% of the volatility variance.
Supply Dynamics and Market Variables
Glassnode classifies coins held for at least 155 days as long-term holder supply. This cohort reached approximately 16.64 million BTC—representing about 83% of the circulating supply—in June, and set another all-time high on July 21. Continued accumulation by long-term holders absorbs coins distributed by other participants, reducing the active trading supply and shifting coins toward holders less likely to spend them in the short term.
Following long-term holder supply, illiquid supply ranked second by explaining approximately 12% of the variance, while liveliness, which measures older-coin spending activity, accounted for about 11%. Other metrics showed substantially weaker relationships:
- Spot Volume: Explained about 7% of the variation.
- Leverage, Exchange Balances, and Futures Open Interest: Registered between approximately 8% and 9%.
- Market Capitalization and Coin Velocity: Ranked near the bottom, each explaining slightly more than 3% of the variation.
Risk Management Implications for Traders
The concentration of supply among long-term holders carries distinct risk-management implications for traders. A smaller liquid supply can moderate price movements when market demand remains balanced. However, it can also magnify price movements if demand shifts sharply or if dormant coins return to circulation, with funding rates, leverage, and futures positioning potentially amplifying the adjustment.
While historical cycles show that periods of unusually low volatility have sometimes preceded significant price advances, researchers emphasize that this relationship is a correlation rather than proof of causation. Fidelity Digital Assets noted that such historical patterns do not serve as dependable forecasts, meaning the current readings describe recent price behavior without determining bitcoin's next directional move.