

Crypto analyst Chain Mind has drawn a correlation between Bitcoin and the S&P 500, noting how the latter could determine the BTC bottom. Based on analysis, the leading crypto has yet to find a bottom, with the stock market still making new highs.
Bitcoin Yet To Bottom With The S&P 500 Still Reach New Highs
In an X post, Chain Mind stated that Bitcoin has never bottomed before the S&P 500 does. He further noted that each BTC bear market ended exactly when the stock market made its final retrace, as in the 2015, 2018, and 2022 cycles. The analyst added that BTC is repeating the same structure again. Meanwhile, he noted that the stock market hasn’t printed its final retrace yet, which means that BTC hasn’t bottomed.
The S&P 500 continues to reach new all-time highs (ATHs), climbing above $7,500 this week, and has yet to see a significant retrace despite the U.S.-Iran war. As such, the Bitcoin bottom may not be in. However, Chain Mind suggested that BTC may soon bottom, with a potential retrace for the stock market on the horizon.
In another X post, Chain Mind stated that the S&P 500 is showing a classic top signal, including a broadening pattern, a parabolic arc, and a fake breakout. He noted that history shows this exact setup before every major top, as this setup appeared during the Dotcom bubble and the financial crisis in 2008. The analyst added that the macro confirms this, with the Buffett Indicator at historical highs, suggesting a dump is imminent. In line with this, he declared that the stock market won’t reach $9,000 as some have predicted.
BTC May Be Forming A Topping Pattern
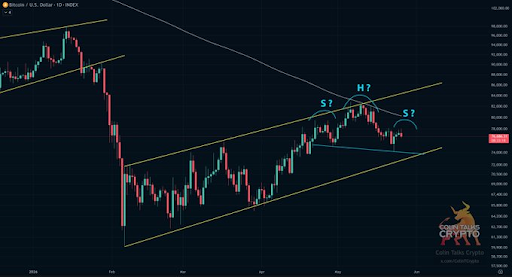
In an X post, crypto analyst Colin stated that he sees the current Bitcoin price action as a potential Head-and-Shoulders topping pattern. He noted that BTC will have to break below the neckline to confirm this bearish pattern. The analyst added that if that happens, the downside target will be $65,000, and that it could even drop lower due to a potential breakdown of the yellow channel, with the target being as low as $61,000. As such, he believes that this is something to keep an eye on.
Meanwhile, crypto analyst Chain Mind revealed that Bitcoin has just printed a Head-and-Shoulders pattern on the 1-week chart. He noted that the cycle structure has played out exactly as expected, with a first peak, a cycle high, a final rebound, and now a dump. He added that BTC has gotten the final rejection to dump and will mark the final bottom at around $50,000.
Related Reading: Everyone Is Calling For Lower Bitcoin Price: Why This Is The Perfect Time To Go Parabolic
At the time of writing, the Bitcoin price is trading at around $75,500, down in the last 24 hours, according to data from CoinMarketCap.

Featured image from Pixabay, chart from Tradingview.com

Editorial Process for bitcoinist is centered on delivering thoroughly researched, accurate, and unbiased content. We uphold strict sourcing standards, and each page undergoes diligent review by our team of top technology experts and seasoned editors. This process ensures the integrity, relevance, and value of our content for our readers.