Bitcoin has achieved a significant milestone by reaching its all-time high of $69K after 847 days, reflecting a notable surge in confidence within the cryptocurrency market.
However, this achievement is accompanied by expectations of heightened volatility in the mid-term, leading to the liquidation of numerous futures market positions.
Technical Analysis
By Shayan
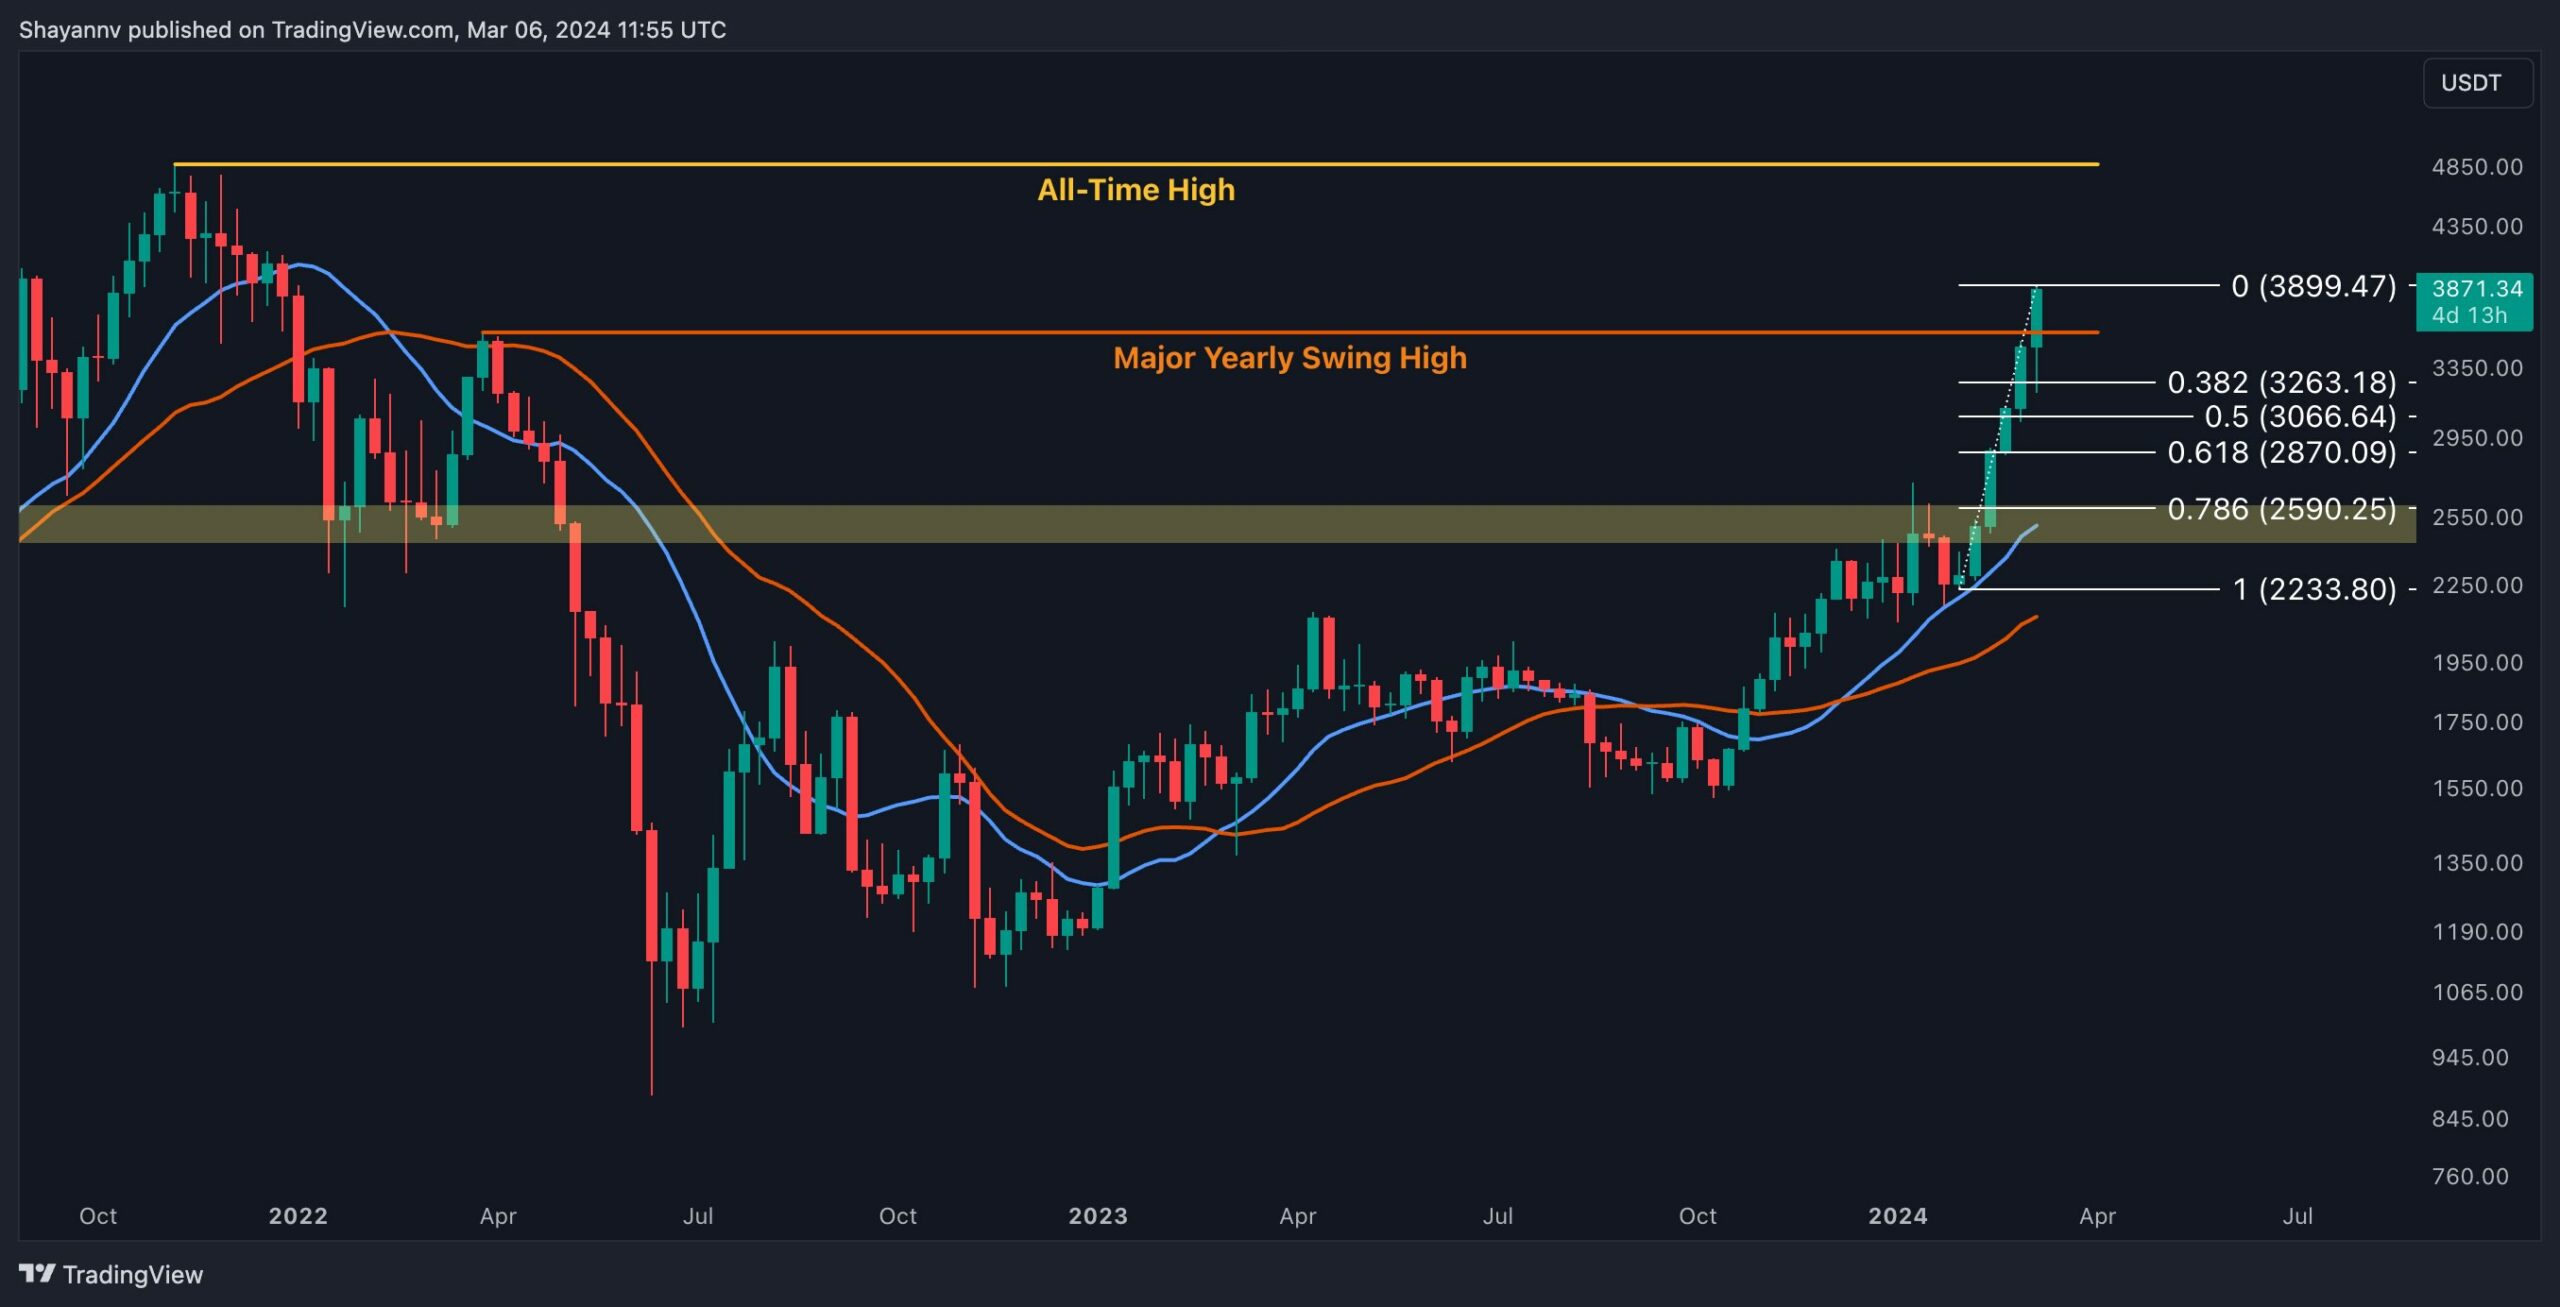
The Daily Chart
A detailed examination of the daily chart highlights Bitcoin’s impressive rally, driven by increased demand and significant capital inflows into spot Bitcoin ETFs, including notable participation from Blackrock. This surge has propelled the price past several critical resistance levels, culminating in Bitcoin’s historical high of $69K.
Despite this upward momentum, the $69K price region presents a significant resistance area characterized by a notable supply overhang, primarily from futures market short positions. This dynamic has contributed to increased volatility, resulting in a 7% decline in price. Additionally, as profit-taking ensues, heightened selling pressure may trigger a temporary phase of consolidation correction.
In the event of a retracement, Bitcoin’s primary support targets on the daily chart lie within the $53K to $49K range. Nonetheless, the broader outlook remains bullish, with Bitcoin eyeing the psychologically significant $100K price region.
The 4-Hour Chart
A closer inspection of the 4-hour chart confirms Bitcoin’s bullish momentum, culminating in attaining the $69K all-time high. This surge underscores investor confidence, driving heightened demand for the cryptocurrency.
However, following the price reaching the critical $69K threshold, a notable rejection occurred, leading to a significant decline. This rejection extended towards the upper boundary of the anticipated ascending channel and key support levels between the 0.5 and 0.618 Fibonacci retracement levels, as anticipated in our prior analysis. Despite this setback, a bullish reversal swiftly occurred, propelling the price back toward the $69K resistance and highlighting buyers’ resilience in the market.
Nonetheless, the market anticipates a period of increased volatility, with the price fluctuating around the crucial $69K mark. Despite potential minor corrections, the overall outlook for Bitcoin remains bullish.

On-chain Analysis
By Shayan
The accompanying chart offers a comprehensive depiction of Bitcoin’s price trajectory alongside the MVRV metric, a vital indicator gauging the coin’s market cap relative to its realized cap. This metric serves as a barometer for evaluating whether the price is overvalued.
Typically, the MVRV metric transitions into the green zone during the late stages of bearish market phases and demonstrates a steady ascent during bullish periods. However, Bitcoin’s recent robust upward trend, culminating in its all-time high of $69K, has led to a sharp rise in the MVRV, reaching levels observed in early 2021. During that time, Bitcoin surged past its previous all-time high of $20K, marking the beginning of a significant bullish market cycle.
This development unequivocally signals the prevailing bullish sentiment in the market, with expectations aligned toward a sustained upward trajectory aimed at new all-time highs.
Nevertheless, amidst Bitcoin’s bullish momentum, periodic corrective movements accompanied by heightened volatility are anticipated. These phases allow the market to recalibrate and participants to capitalize on their profits, contributing to the market’s overall health.

Binance Free $100 (Exclusive): Use this link to register and receive $100 free and 10% off fees on Binance Futures first month (terms).
Disclaimer: Information found on CryptoPotato is those of writers quoted. It does not represent the opinions of CryptoPotato on whether to buy, sell, or hold any investments. You are advised to conduct your own research before making any investment decisions. Use provided information at your own risk. See Disclaimer for more information.
Cryptocurrency charts by TradingView.