
The Bitcoin (BTC) price bounced last week, seemingly ending a consolidation movement that had been going on for nearly a month.
However, BTC has yet to break out from a crucial descending resistance line. Doing so is necessary to confirm the bullish trend reversal.
How Does Bitcoin’s Movement Compare to the Previous Cycle?
The ongoing BTC descent since the November 2021 all-time high shares an interesting similarity with that after the 2017 high. During both Bitcoin cycles, the bottoms were reached after 12 months. Furthermore, they marked a temporary RSI decrease below 50 (green circle) before an eventual increase above 50.
The RSI is a momentum indicator used by traders to evaluate whether a market is overbought or oversold and to determine whether to accumulate or sell an asset. Readings above 50 and an upward trend suggest that bulls still have an advantage, while readings below 50 indicate the opposite.
Check out the Best Crypto Sign-Up Bonuses in 2023
In the previous cycle, the BTC price initiated a 340% upward movement (green) that continued for 180 days. Afterward, it corrected by 70% over a period of 270 days before beginning the next cycle. The price never closed below the long-term horizontal support of $6,500.
In the current cycle, the Bitcoin price began a much more gradual upward trend, increasing by 100% in a period of 240 days, leading to the 2023 high of $31,800 in July.
If the cycle follows a similar path to the last one, the BTC price will correct until the end of the year. This could be aided by FTX’s plans to liquidate $560 million in Bitcoin. However, since the increase was more gradual, it is possible that the same will hold true for the correction. A fall to the closest long-term horizontal support would be a drop of another 25%.
Bitcoin Bounces After Bullish Divergence – Will It Break Out?
The technical analysis for the daily timeframe gives conflicting signs. This is due to the bearish price action and relatively bullish RSI.
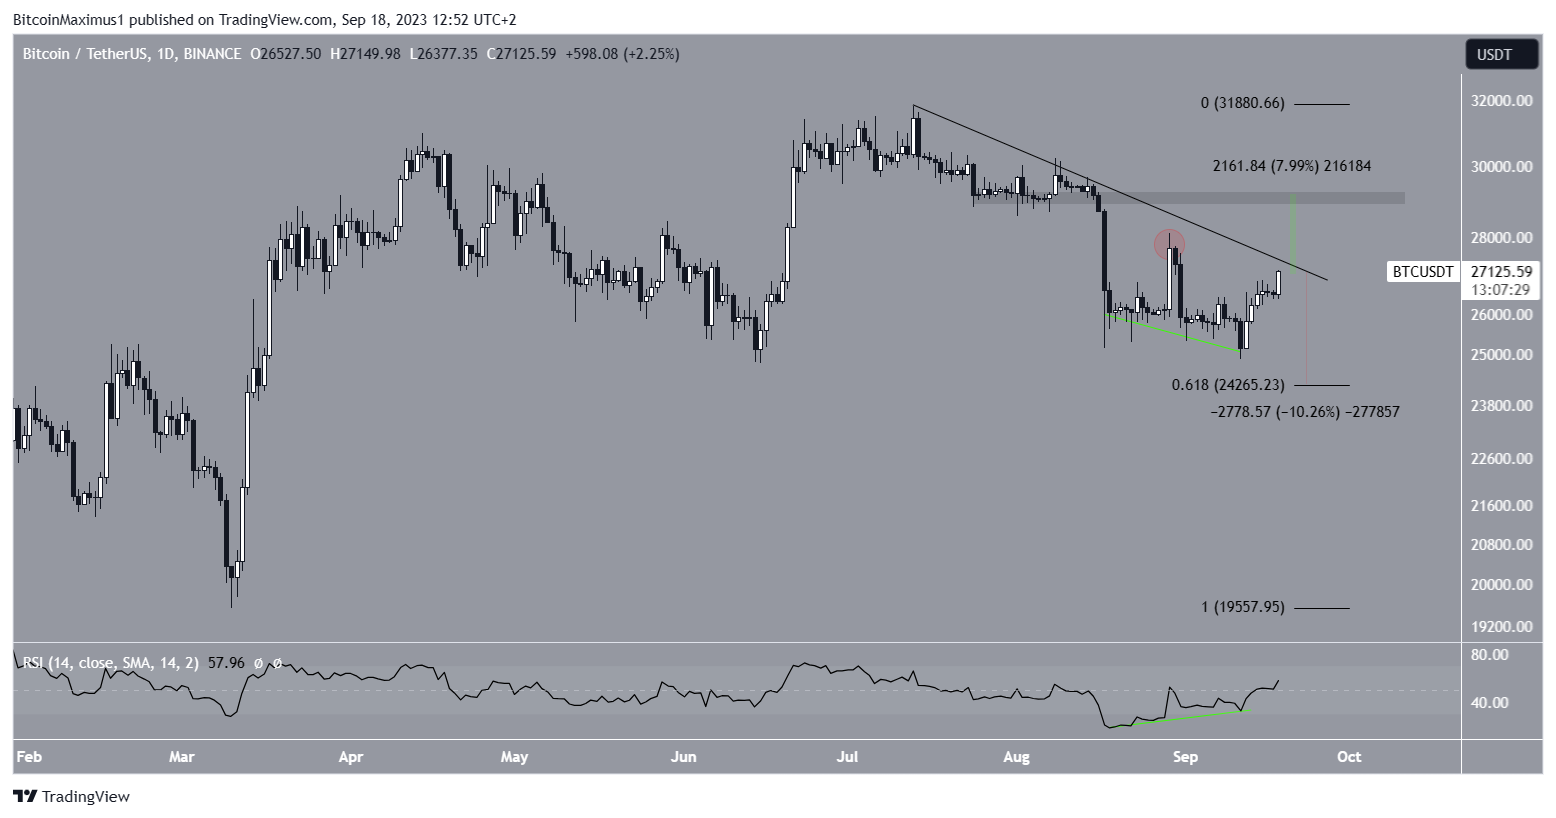
The price action shows that the BTC price has fallen since the yearly high of $31,800 on July 13. The decrease has been contained inside a descending resistance line. The line rejected the price on August 14 (red icon). While it bounced afterward, it failed to reach the resistance line (red circle), a sign that bulls were not strong enough to sustain the bounce.
Stay ahead in the game with Bitcoin (BTC) price forecasts.
If the BTC price breaks out from the line, it can reach the next resistance at $29,200. The resistance area is 10% above the current price. On the other hand, failure to sustain the increase can lead to an 8% drop to the 0.618 Fib retracement support level at $24,300.
The daily RSI provides a mostly bullish reading. While the RSI has yet to move above 50, it is increasing significantly. Moreover, the indicator has generated a bullish divergence. A bullish divergence occurs when a momentum increase accompanies a price decrease. It often leads to sharp upward movements, as has been the case in BTC so far. As a result, the RSI supports the possibility of an eventual breakout.
Therefore, the future BTC price prediction will likely depend on whether the price will break out from the resistance line or get rejected. An 8% increase could occur in case of a breakout, while a 10% drop could follow if a rejection occurs.
Learn to trade: How to Use RSI Indicator in Crypto Trading.
For BeInCrypto’s latest crypto market analysis, click here.
The post Bitcoin’s Historical Cycles: Lessons From 2017 Predict 2023 Bull Run appeared first on BeInCrypto.