
Recent days have witnessed a notable dip in the number of BNB transactions, hinting at a possible slowdown. Coupled with a persistently high RSI well into the overbought zone, this suggests the BNB price might be poised for more downward adjustments as the market seeks equilibrium.
The emergence of bearish formations on the BNB price chart warrants investors’ attention. Such patterns are often harbingers of continued negative momentum and should be considered red flags for those monitoring the cryptocurrency’s near-term price trajectory.
BNB Chain Number of Transactions May Enter Into a Negative Trend
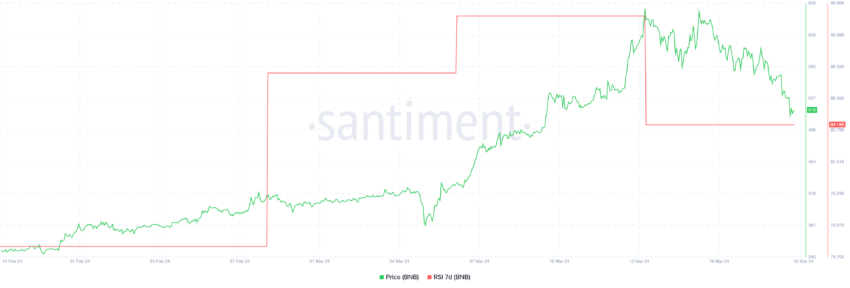
BNB’s number of transactions has been pretty stable since January 2024, with some peaks here and there. Its price, however, went from $313 on January 1 to $632 on March 15. This represents a growth of 101% in just over two months. This may suggest that the BNB price has been strongly affected by the overall crypto bull run this year and not by fundamentals.
Comparing BNB with the top 21 biggest cryptocurrencies in market cap – excluding memecoins and stablecoins – will show that, besides NEAR and Solana, BNB price growth YTD (year-to-date) outperformed all of them.
This recent decline in the number of daily transactions and also in its 7D moving average could indicate that users are not willing to bet on BNB anymore. Since it already grew a lot this year, other opportunities could bring higher ROI (Return On Investment).
Read More: BNB: A Comprehensive Guide to What It Is and How It Works
Relative Strength Index Indicator is Still High
For BNB, its Relative Strength Index (RSI) at 84 is well into the overbought range. This suggests that the asset has been strongly bought by the market and may be overvalued at that moment. That increases the likelihood of a price correction or pullback.
Traders might interpret an RSI at this level as a signal that the buying momentum may be exhausted, and the asset could be due for a downturn as some investors start to sell to realize profits.
The RSI is a momentum oscillator that measures the speed and change of price movements on a scale from 0 to 100.
This metric is most commonly used to identify overbought or oversold conditions in the trading of an asset. An RSI reading above 70, like BNB right now, is typically considered overbought. An RSI below 30 is considered oversold. These levels indicate that an asset’s price has experienced significant movement. This asset could be due for a reversal or corrective pullback in price.
BNB Price Prediction: BNB Could Retract By 18% if This Happens
At its current price of $519, BNB is perched near a pivot point. If the price descends, it might rigorously test the next support level around $426, especially if the downtrend persists. This would represent a decrease of roughly 17.9% from its current standing.
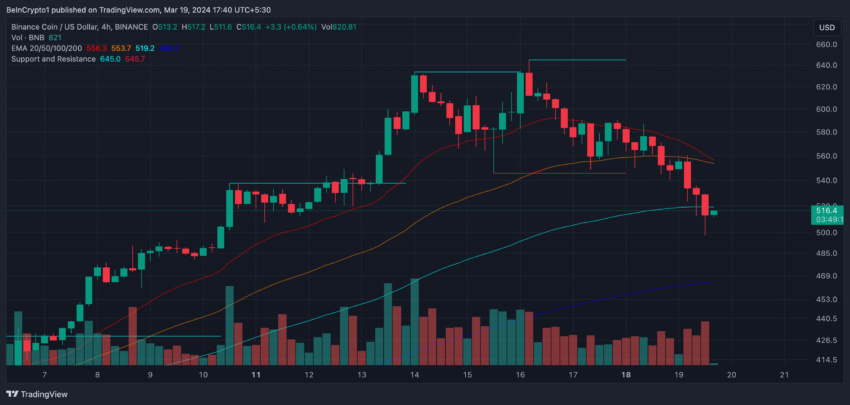
The Exponential Moving Average (EMA) lines on the price chart serve to provide insight into the asset’s momentum and potential price direction. Often, traders see the 20 EMA dipping below the 50 EMA as a bearish signal.
That indicates that short-term momentum is weakening relative to the medium-term. This ‘cross’ could suggest to traders that the asset might continue to decline unless other indicators signal a shift in momentum.
Read More: How To Buy BNB and Everything You Need To Know
In contrast, if BNB manages to reverse the downturn, there’s an opportunity to rechallenge the $537 resistance level. Surpassing this could pave the way for a further rise to $635, marking a more substantial growth of approximately 22.3%.
The post BNB Price Forecast: Will the Recent Dip Lead to Further Declines? appeared first on BeInCrypto.