The Cardano (ADA) price has decreased for more than a month and trades close to the support line of a long-term corrective pattern.
The price broke down from a short-term horizontal support area, which stood since the start of the year.
Cardano Falls Inside Corrective Pattern
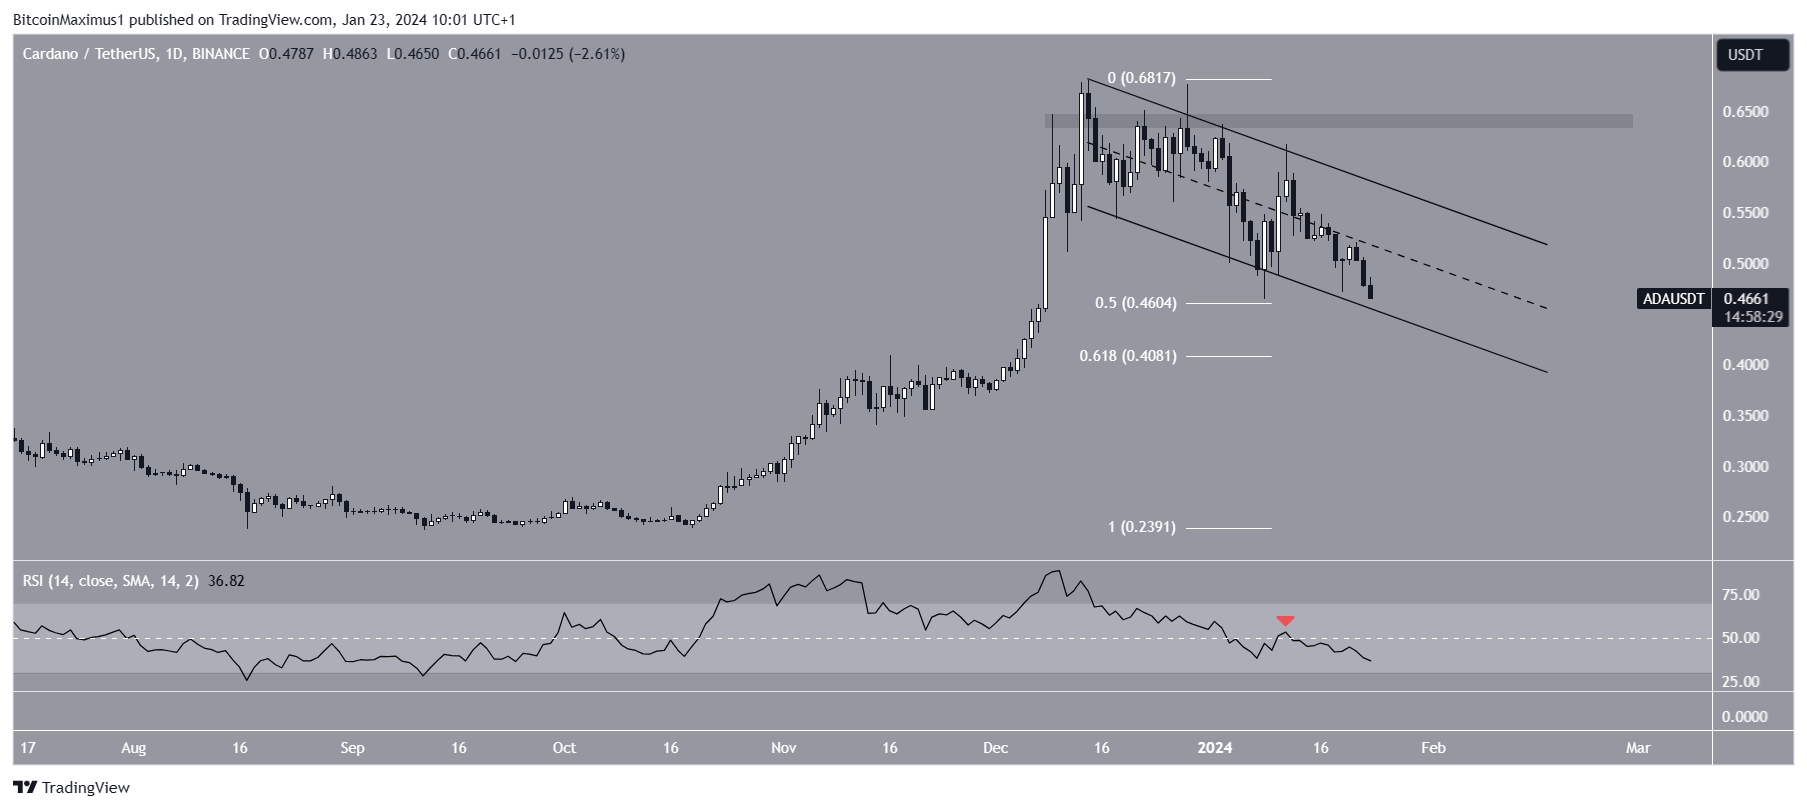
The Cardano price has fallen since reaching its 2023 high on December 14, 2023. The decrease confirmed a deviation above a horizontal resistance area (red circle).
Since then, the downward movement has been contained inside a descending parallel channel. Both its resistance and support trend lines have been validated numerous times, the latter coinciding with a Fib retracement support level. ADA currently trades very close to the channel’s support trend line.
The daily RSI gives a bearish reading. When evaluating market conditions, traders use the RSI as a momentum indicator to determine whether a market is overbought or oversold and whether to accumulate or sell an asset.
If the RSI reading is above 50 and the trend is upward, bulls still have an advantage, but if the reading is below 50, the opposite is true. The indicator is below 50 and falling (red icon), both signs of a bearish trend.
Read More: How To Stake Cardano (ADA)
ADA Price Prediction: Breakdown or Bounce?
The technical analysis from the six-hour time frame aligns with the bearish reading from the daily one. This is because of the price action, RSI, and Elliott Wave count.
The price action shows that ADA broke down from the $0.48 horizontal support area, which has stood since the start of the year. The RSI supports this bearish prediction since it is below 50 and falling.
Read More: How to Buy Cardano
Elliott Wave theory involves the analysis of recurring long-term price patterns and investor psychology to determine the direction of a trend.
Read More: Best Cardano Wallets for Secure ADA Storage
The wave count states that ADA is in the C wave of an A-B-C corrective structure. Giving waves A:C a 1:1 ratio will lead to a low of $0.405, an 11% ADA decrease from the current price.
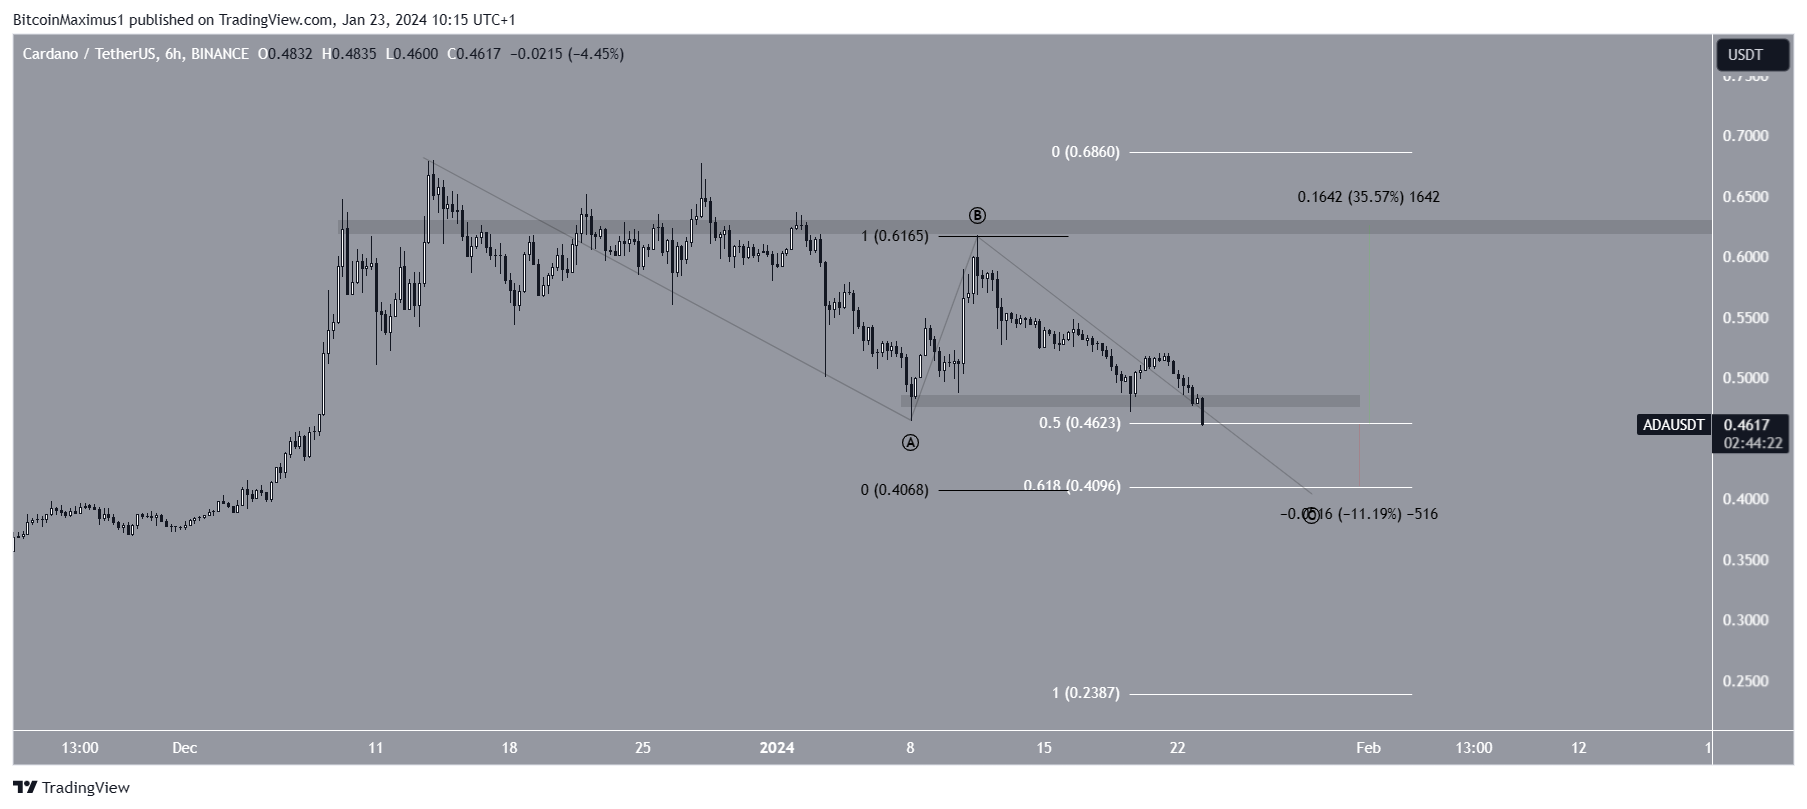
Despite this bearish ADA price prediction, reclaiming the $0.48 horizontal area will invalidate the breakdown. Then, ADA could increase 25% to the range high of $0.62.
For BeInCrypto’s latest crypto market analysis, click here.
![]()
FXGT.com
FXGT.com” target=”_blank”>Explore →
![]()
Bitrue
Bitrue” target=”_blank”>Explore →
![]()
Metamask Portfolio
Metamask Portfolio” target=”_blank”>Explore →
![]()
KuCoin
KuCoin” target=”_blank”>Explore →
![]()
Сoinex
Сoinex” target=”_blank”>Explore →
![]()
Kraken
Kraken” target=”_blank”>Explore →
The post Cardano (ADA) Price Decrease Continues Below $0.50 – When Will it End? appeared first on BeInCrypto.