 Bulls in Control as Price Hits Yearly High – on the Horizon?")
The Chainlink (LINK) price ended six weeks of consolidation by reaching a new yearly high of $17.68 today.
Despite the high, LINK still trades inside a long-term horizontal resistance area. Will it break out before the end of the year?
Chainlink Reaches New Yearly High
The LINK price has increased since falling to a low of $4.90 in June. Initially, LINK failed to break out from a long-term descending resistance trend line (red icon). However, it was finally successful in moving above it in September.
The upward movement led to a high of $16.58 in November, but it has slowed down since. After consolidating for six weeks, the LINK price finally began an upward movement this week, leading to a new yearly high of $17.68, inside a long-term horizontal resistance area.
Market traders use the RSI as a momentum indicator to identify overbought or oversold conditions and to decide whether to accumulate or sell an asset.
Readings above 50 and an upward trend indicate that bulls still have an advantage, whereas readings below 50 suggest the opposite. The RSI has generated bearish divergence (green) and is falling, both considered signs of weakness.
Read More: How to Buy Chainlink With a Credit Card
What Do the Analysts Say?
Cryptocurrency traders and analysts on X are decisively bullish on the future LINK trend.
Inmortal believes the LINK price will soon break out from its symmetrical triangle and increase above $20. He also suggests that there is a rotation going on by stating:
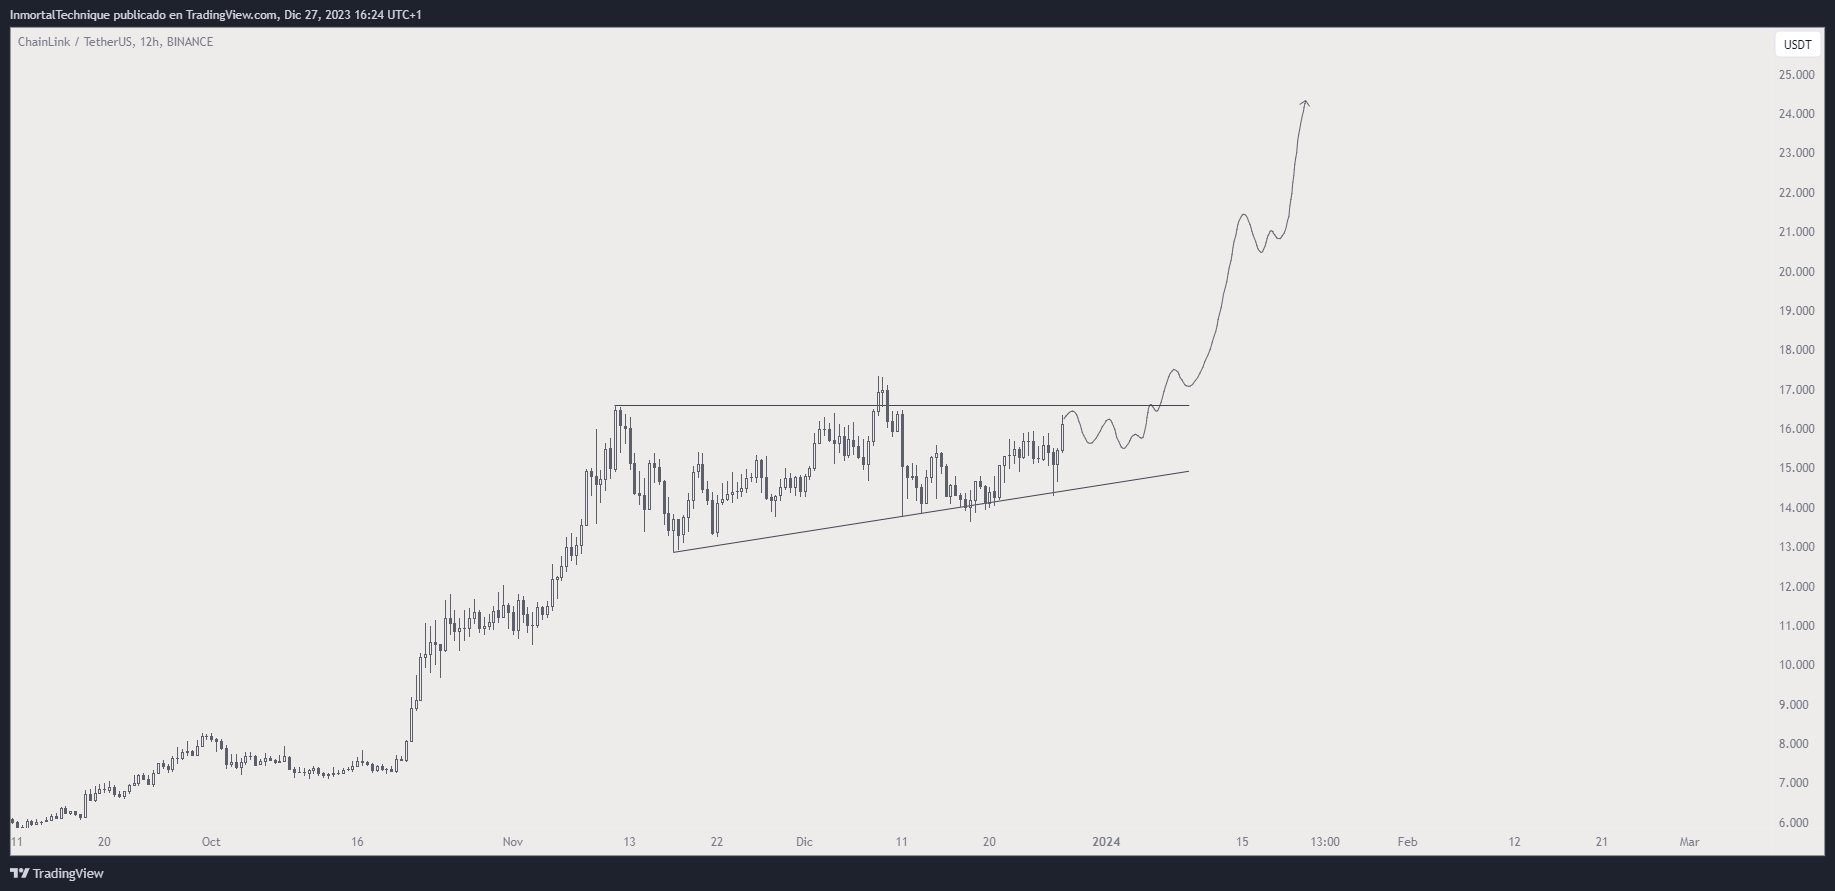
Bubbafox is bullish for fundamental reasons, and Kyle Chase suggests that the LINK price increase will become parabolic soon.
Read More: What is Chainlink (LINK)?
LINK Price Prediction: $20 Before Year-End?
Technical analysts employ the Elliott Wave theory to identify recurring long-term price patterns and investor psychology, which helps them determine the direction of a trend.
The most likely count suggests that LINK has begun the fifth and final wave (black) in an upward movement that started in June.
If the count is correct, LINK completed wave four on December 18 and then began wave five. The fact that the daily RSI broke out from its bearish divergence trend line supports this possibility.
If LINK breaks out from the channel, the most likely target for the top of the upward movement is $23.75, 50% above the current price. The target is found by giving wave five the same length as wave one.
It also coincides with the resistance trend line of a long-term ascending parallel channel and a long-term horizontal resistance area.
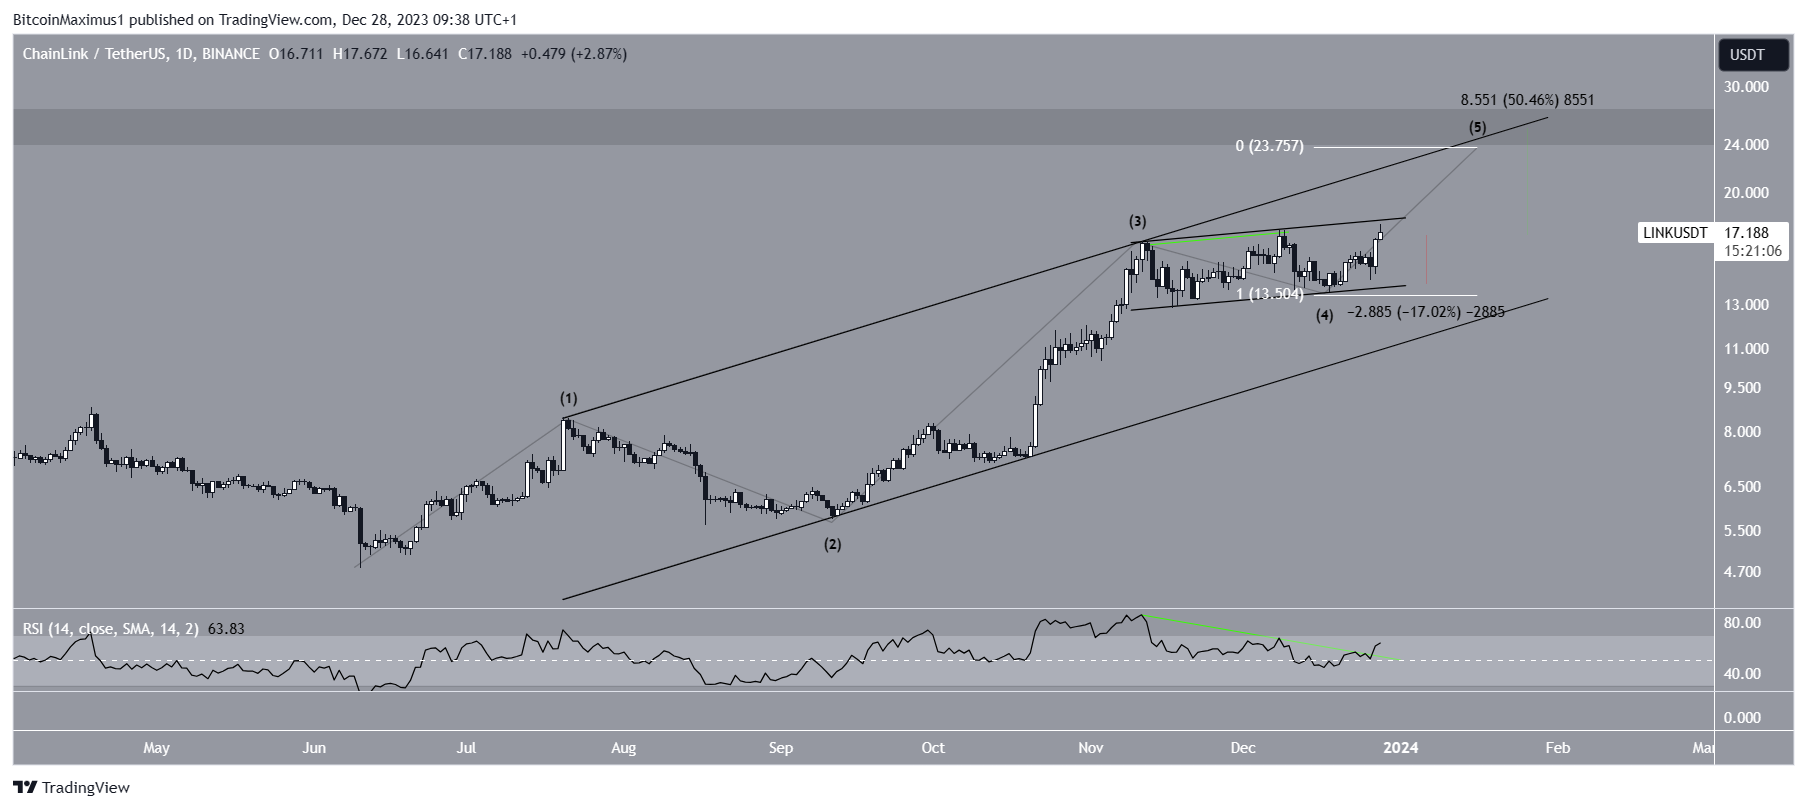
Despite this bullish LINK price prediction, a rejection from the channel’s resistance trend line can cause a 17% drop to the channel’s support trend line at $14.
For BeInCrypto‘s latest crypto market analysis, click here
Best crypto platforms in Europe | January 2024
![]()
KuCoin
KuCoin” target=”_blank”>Explore →
![]()
Wirex App
Wirex App” target=”_blank”>Explore →
![]()
YouHodler
YouHodler” target=”_blank”>Explore →
![]()
Margex
Margex” target=”_blank”>Explore →
Explore more
The post Chainlink (LINK) Bulls in Control as Price Hits Yearly High – $20 on the Horizon? appeared first on BeInCrypto.