The Manta Network (MANTA) and PENDLE price have retraced their entire correction from January 22 and moved to new all-time highs.
How long will these price increases continue? Let’s find out!
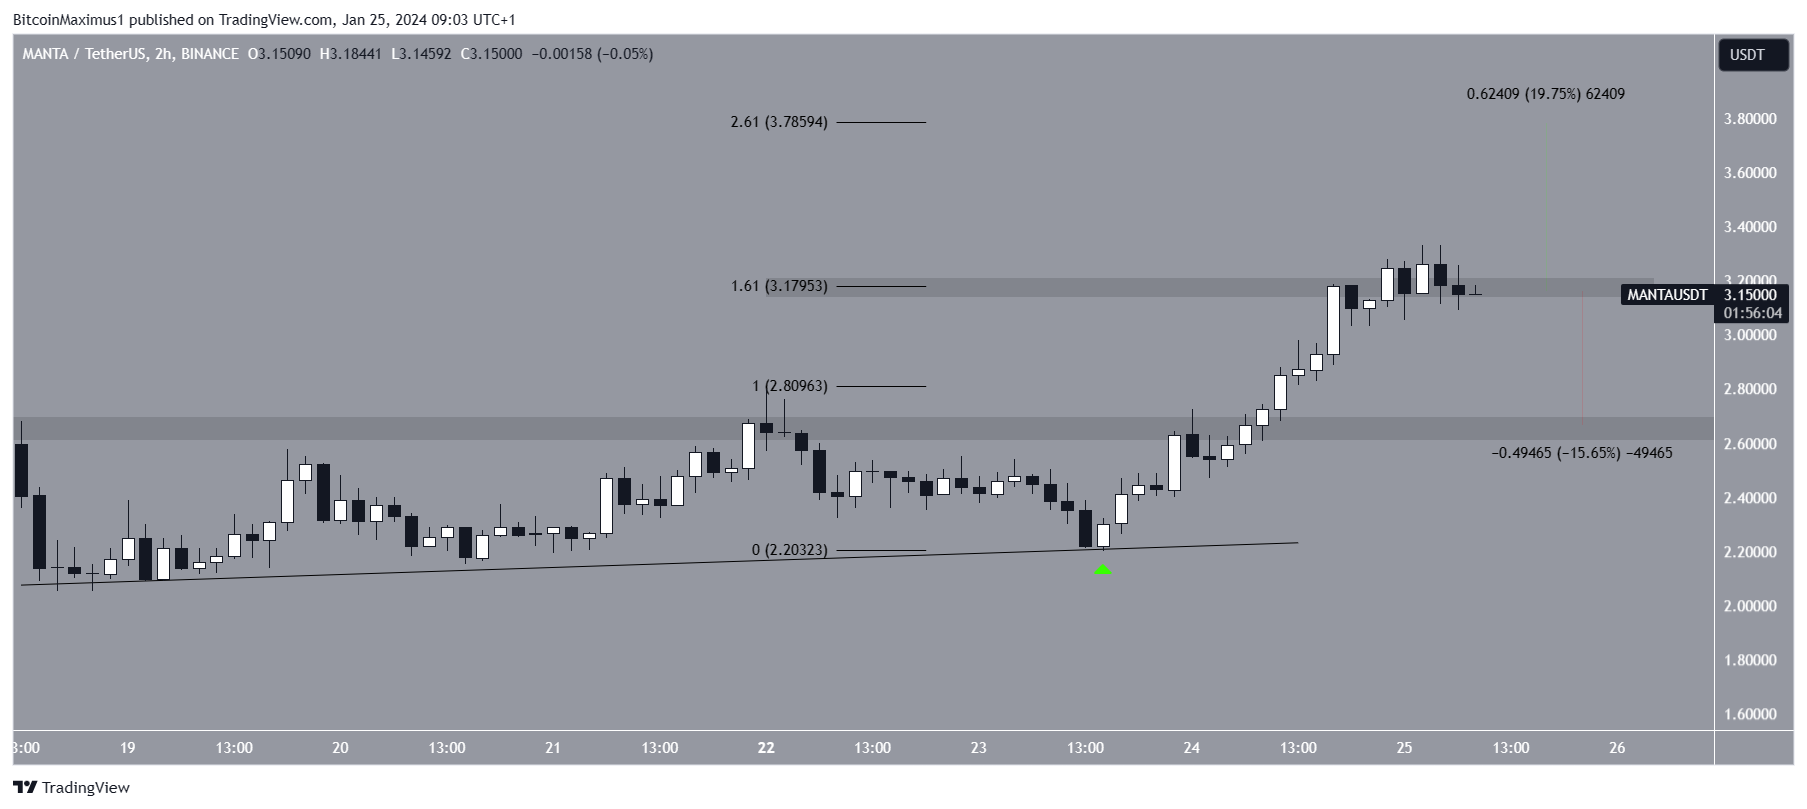
MANTA Price Reaches All-Time High
The MANTA price has increased alongside an ascending support trend line since its listing on Binance on January 18. It also followed a horizontal resistance area at $2.65 during this time.
After bouncing at the trend line on January 23 (green icon), MANTA accelerated its rate of increase, breaking out from the horizontal area the next day.
Today, the MANTA price reached a new all-time high of $3.33. Cryptocurrency trader SatoshiFlipper is bullish and believes MANTA is reaching $10.
Read More: What Are Altcoins? A Guide to Alternative Cryptocurrencies
However, MANTA still attempts to move above the 1.61 external Fib retracement at $3.18. If MANTA bounces, it can increase 20% to the next resistance at $3.80.
Despite this bullish MANTA price prediction, a rejection from the $3.18 area could trigger a 16% drop back to the $2.65 support area.
PENDLE Parabolic Increase Continues
The PENDLE price has increased alongside a parabolic ascending support trend line since August 2023. The trend line has been validated numerous times, most recently on January 8 (green icon). PENDLE reached a new all-time high price of $2.47 today.
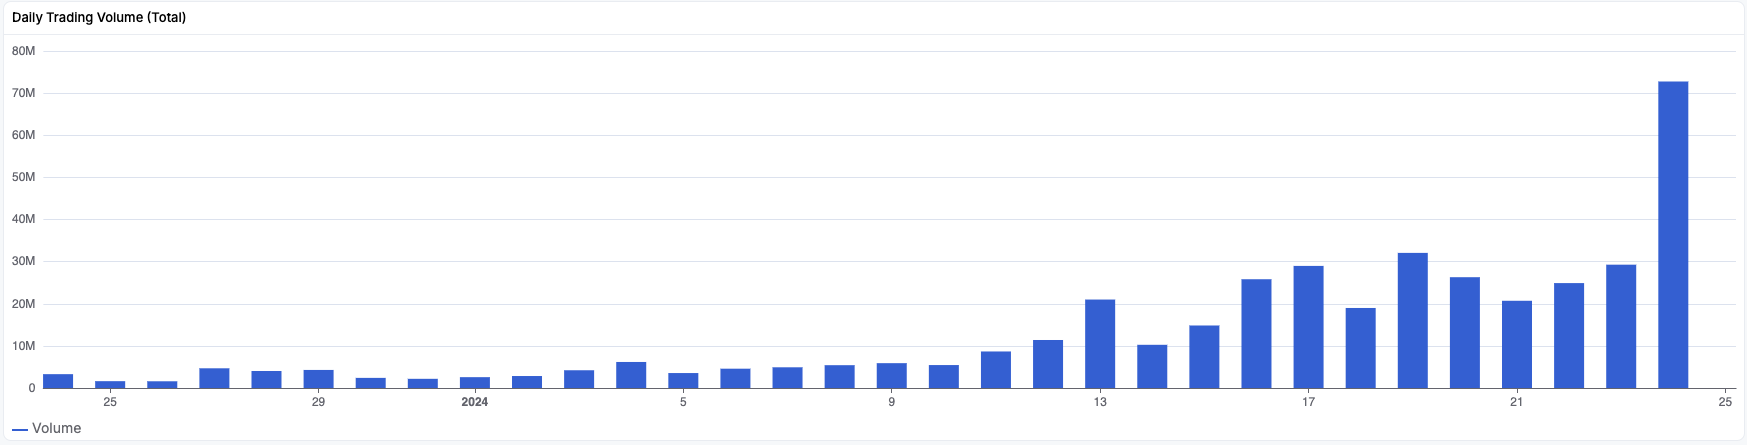
Analyst Matthew Potts noted that PENDLE more than doubled its all-time high in daily trading volume yesterday.
The wave count suggests the increase will continue. Elliott Wave theory involves the analysis of recurring long-term price patterns and investor psychology to determine the direction of a trend.
The most likely count states that the PENDLE price is in the fifth and final wave of an upward movement (white). The most likely target for the top of the increase is $3.45, 40% above the current price.
Read More: 13 Best Altcoins to Invest in January 2024
The target is found by giving wave five the same length as waves one and three (white) and the 2.61 external Fib retracement of the previous drop.
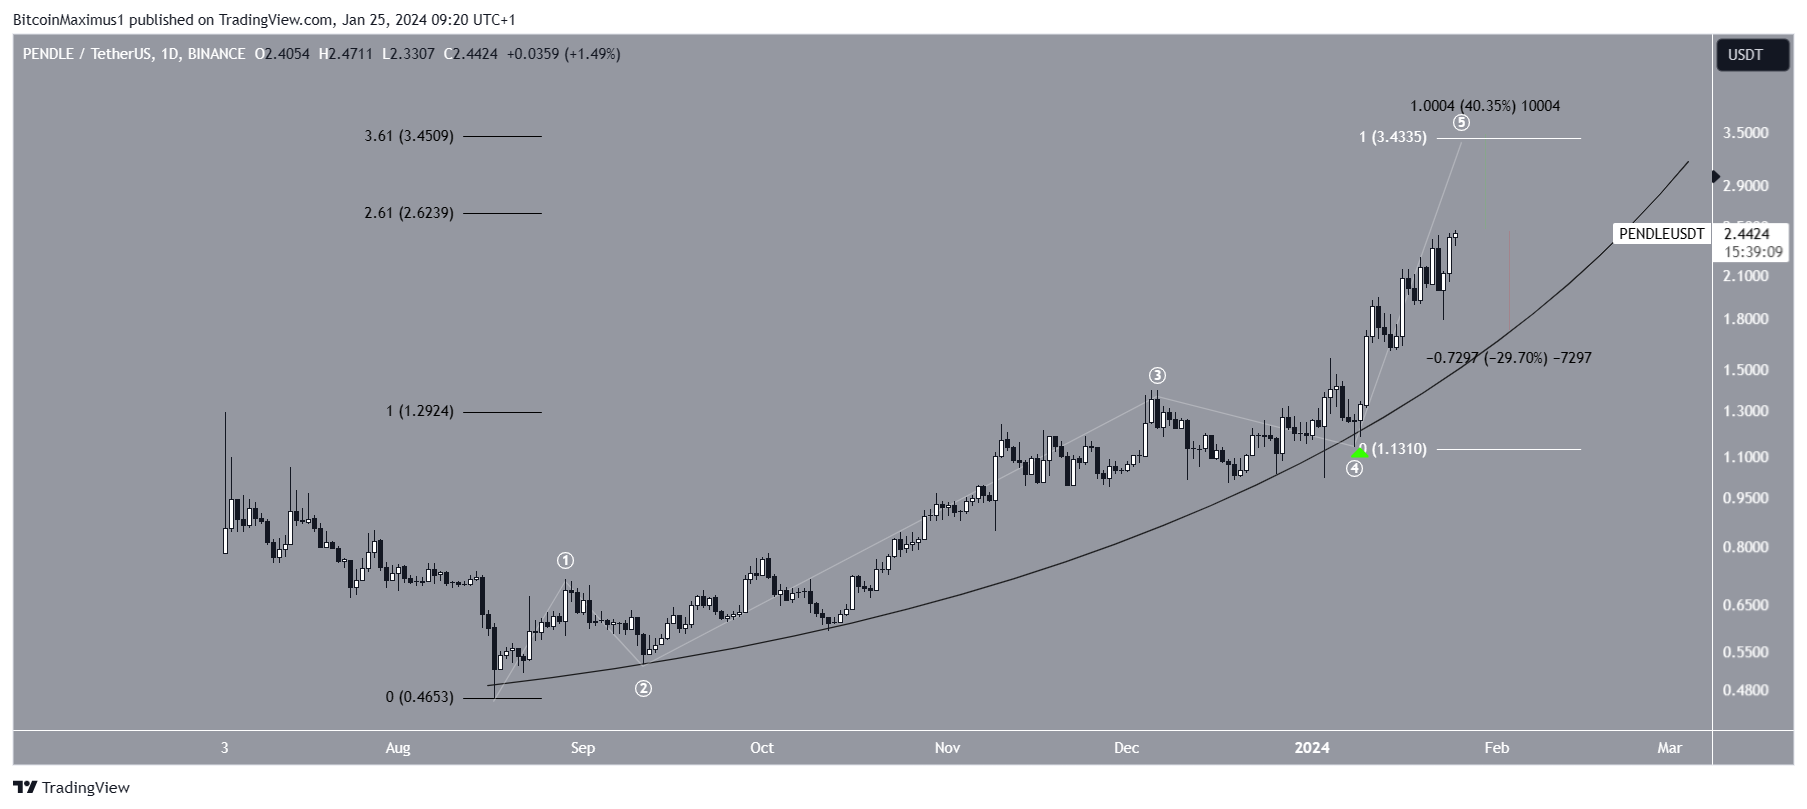
Despite this bullish PENDLE price prediction, a rejection from the $2.62 resistance can trigger a 30% rejection to the parabolic support trend line at $1.80.
For BeInCrypto‘s latest crypto market analysis, click here.
![]()
GT Protocol
GT Protocol” target=”_blank”>Explore →
![]()
DeGate
DeGate” target=”_blank”>Explore →
![]()
Metamask Portfolio
Metamask Portfolio” target=”_blank”> Explore →
![]()
UpHold
UpHold” target=”_blank”>Explore →
![]()
BYDFi
BYDFi” target=”_blank”>Explore →
Explore more
The post Crypto Market Shake-Up: Two Altcoins Surge Into Top 100, Hitting New All-Time Highs appeared first on BeInCrypto.