 Price Clears 900-Day Trend Line – What Challenges Lie Ahead?")
The Dogecoin (DOGE) price broke out from long- and short-term descending resistance trend lines.
Despite the breakout, the DOGE price increase stalled on Nov. 11. Will the price fall or regain its footing?
Dogecoin Clears 900-Day Resistance Trend Line
The weekly time frame technical analysis shows that the Dogecoin price broke out from a descending resistance trend line in October.
Before the breakout, the trend line had been in place for 900 days, leading to three significant rejections (red icons). After the breakout, DOGE reached a high of $0.082 before falling slightly.
Read more: (DOGE) Dogecoin Price Prediction
After the breakout, the weekly Relative Strength Index (RSI) moved above 50.
The RSI is a momentum indicator traders use to evaluate whether a market is overbought or oversold and whether to accumulate or sell an asset.
Readings above 50 and an upward trend suggest that bulls still have an advantage, while readings below 50 indicate the opposite.
A movement above 50 is a positive sign.
Well-known cryptocurrency trader Crypto Tony also noted the breakout from the descending resistance trend line. A similar chart was produced by Rekt Capital, who was previously skeptical about the upward movement.
Read more: How To Buy Dogecoin (DOGE) and Everything You Need To Know
DOGE Price Prediction: Start of a Reversal?
While the weekly time frame is decisively bullish, the daily one casts doubt whether the upward movement will continue in the short-term. The main reason for this is the daily RSI.
During the most recent highs, the daily RSI has generated a bearish divergence. A bearish divergence occurs when a momentum decrease follows a price increase. It often leads to downward movements.
Additionally, the altcoin has created successive long upper wicks (red icons), considered signs of selling pressure.
If the DOGE price begins to fall, a 15% decrease to the closest support area at $0.067 will be expected.
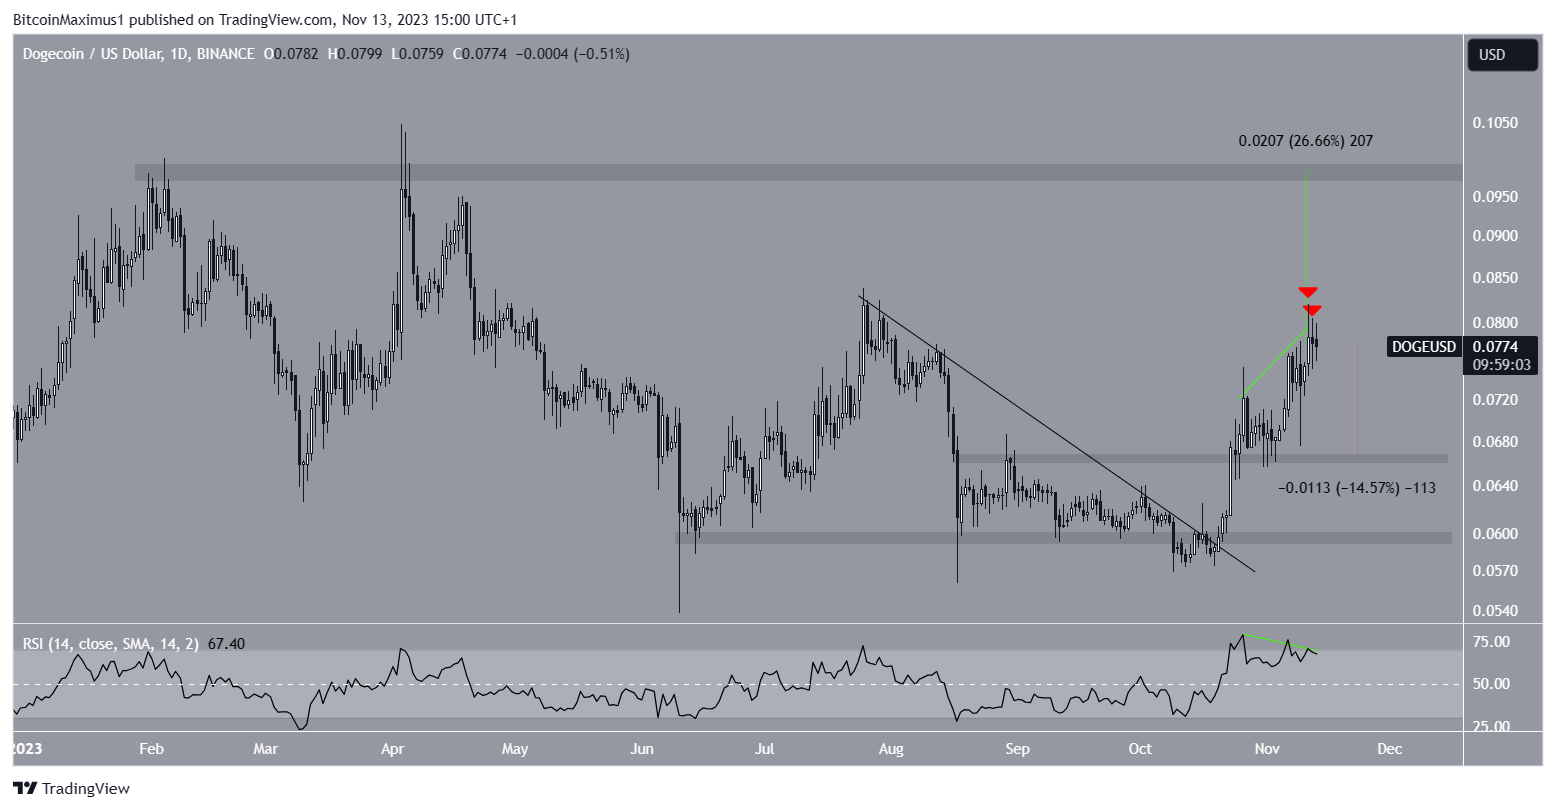
Despite the pessimistic forecast for DOGE’s price, if DOGE surpasses the November peak of $0.082, it will indicate the conclusion of the correction. A 24% rise toward the subsequent resistance level at $0.100 is anticipated in such a scenario.
Read More: Crypto Signals: What Are They and How to Use Them
For BeInCrypto’s latest crypto market analysis, click here.
Top crypto platforms in the US | November 2023
Paybis
Paybis” target=”_blank”>No fees for 1st swap →
iTrustCapital
iTrustCapital” target=”_blank”>Crypto IRA →
Coinbase
Coinbase” target=”_blank”>$200 for sign up →
Uphold
Uphold” target=”_blank”>No withdrawal fee →
eToro
eToro” target=”_blank”>$10 for first deposit →
BYDFi
BYDFi” target=”_blank”>No KYC trading →
The post Dogecoin (DOGE) Price Clears 900-Day Trend Line – What Challenges Lie Ahead? appeared first on BeInCrypto.