In this article we take a look at the general outlook of Ethereum, conducting a detailed analysis of the price and observing some on-chain indicators.
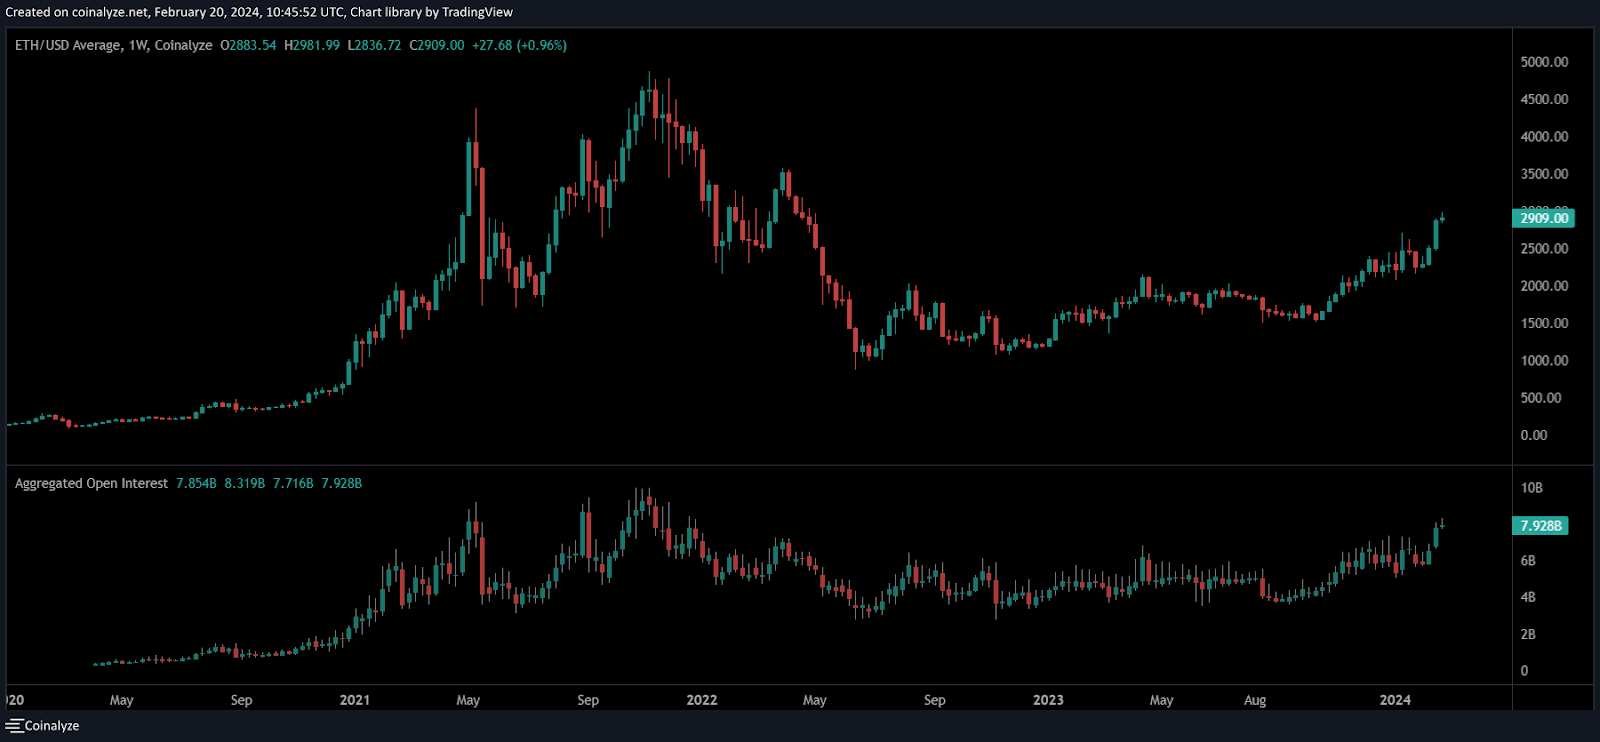
Yesterday, ETH tried in vain to break through the $3,000 wall, which is currently acting as the main resistance, being rejected back to the current price of $2,908.
However, Ethereum remains the most fit in the crypto market, outperforming even Bitcoin.
On the on-chain front, data shows a long-standing and strong network, supported by an increase in the number of validators and coins locked in staking, as well as a high average trading volume.
All the details below.
Ethereum leads FOMO in the crypto markets: ETH price analysis shows the asset’s willingness to break the $3,000 resistance
In this beginning of the week, decidedly quiet, due to yesterday’s closure of the US markets for President’s day holiday, crypto markets are led by Ethereum and its recent attempt to surpass the key price of 3,000 USD.
While Bitcoin registered its local maximum on Thursday, February 15th, at a level of 52,816 USD, Ethereum showed more determination by reaching a new annual high of 2,984 USD yesterday, without however succeeding in closing at a round figure.
The price analysis shows a relative strength for ETH, which convincingly absorbs every dip and keeps market expectations high.
Traders are optimistic about the future of ether and are betting on the positive outcome of the approval of the spot ETF in the USA for the second largest cryptocurrency by market capitalization, with several Fund Managers such as Franklin Templeton, BlackRock, Fidelity, Ark and 21Shares, Grayscale, VanEck, Invesco and Galaxy and Hashdex that have already filed their requests with the Securities and Exchange Commission.
If things were to go well, ETH could even approach $3,500, a level not seen since April 2022, and then probably even $4,000 ETH.
Just to give an idea of the timing, the SEC still has 96 days before the final deadline to make a decision on the potential approval/rejection
On the more technical side of prices, the analysis highlights how since October 2023 Ethereum has been channeled into a very compact bullish trend, capable of holding the EMA 50 daily very firmly and constantly updating new highs after each short correction attempt.
More in detail, from mid-January onwards the bulls have made themselves heard in a unanimous way, bringing the prices of ether from $2,200 up to the current values.
The psychological threshold of $3,000 could now oppose new bullish incursions, with RSI showing the first signs of weakening in a trend that is heading towards overbought territory.
Anyway, the consistently high volumes recorded in the last trading sessions and the recent breakout above 2,700 USD seem to favor a positive scenario for the cryptocurrency, which will likely break the resistance it is facing, albeit after several efforts.
In the field of derivatives, data analysis on Ethereum highlights a decidedly encouraging open interest, which last week reached an aggregated value on all trading platforms exceeding 7.7 billion dollars, a value that has not been seen since November 2021.
Even the funding rate shows positive signals with a positive leverage funding rate on all major markets, and with numbers higher than those recorded in the last 6 months.
This means that the speculative interest in Ethereum is high and that speculators are positioning themselves (and have largely already positioned themselves) with the idea that the crypto will increase in price in the short term.
Pay attention to the volatility in this period because it could lead to forced liquidations: in particular, the levels of 2,877 USD, 2,870 USD, and 2,840 USD are the prices that could trigger losses for long positions excessively exposed to leverage.
The on-chain data of the Ethereum network
After analyzing the price of Ethereum, let’s see what the on-chain data of the decentralized network are signaling to us.
Even in this case the overall outlook is largely positive, with most indicators showing the presence of a fertile ground for further growth of the asset.
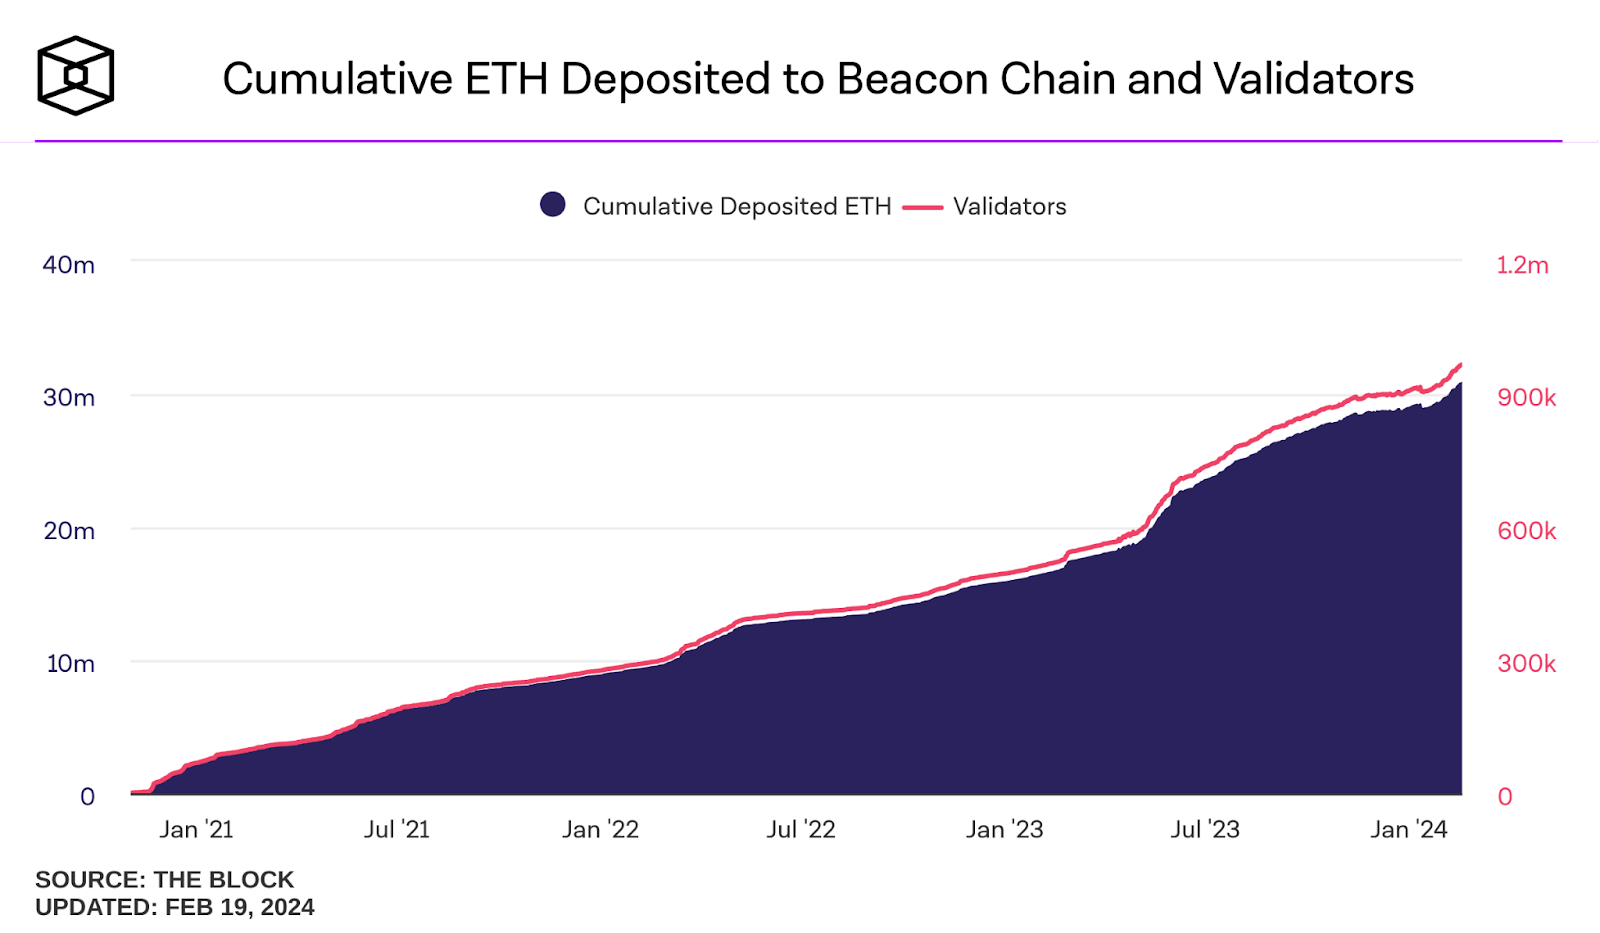
In particular, we observe how the number of ETH deposited on the Beacon Chain is constantly growing, as well as the number of new validators joining the network to provide their support.
As of today, about 30.87 million ETH, equivalent to over 9 billion dollars, are locked inside the protocol PoS with about 900 thousand validators among individual users and LST platforms.
Considering a circulating supply of Ethereum close to 120 million coins, we can affirm that over 25% of all ETH in circulation are locked in the Beacon chain.
This only serves to decrease the potential selling pressure and cause a scarcity of ether in the crypto markets.
This data, combined with the potential digital scarcity that will be triggered by the likely arrival of ETH spot ETFs, could push the currency towards very ambitious price levels if demand starts to be felt even slightly.
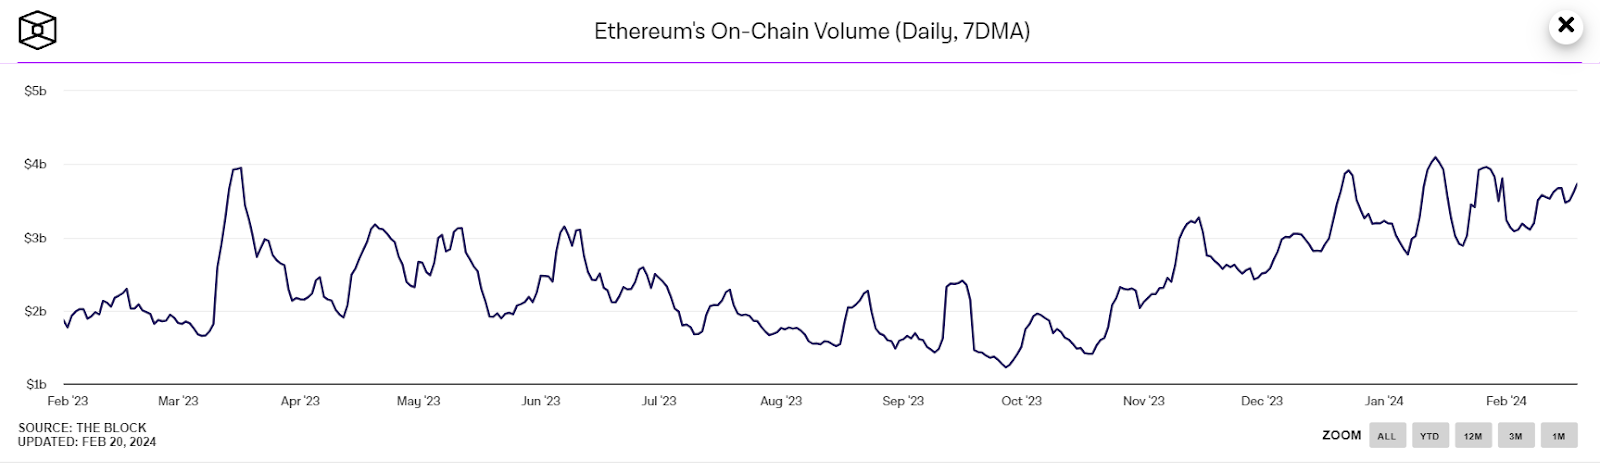
It is also very interesting to note how the average volume recorded in transactions on the Ethereum chain has remained consistently high in these first weeks of 2024, reaching the maximum level of 4 billion USD daily, reached as a maximum in March 2023.
A high volume supports speculative interest in the price of ETH, which coincidentally has increased precisely in conjunction with the cryptocurrency rally from October onwards.
Airdrops, fomo for new DeFi protocols and new memecoins have supported the network’s trading volume throughout 2023, with a boost in metrics in the last few months.
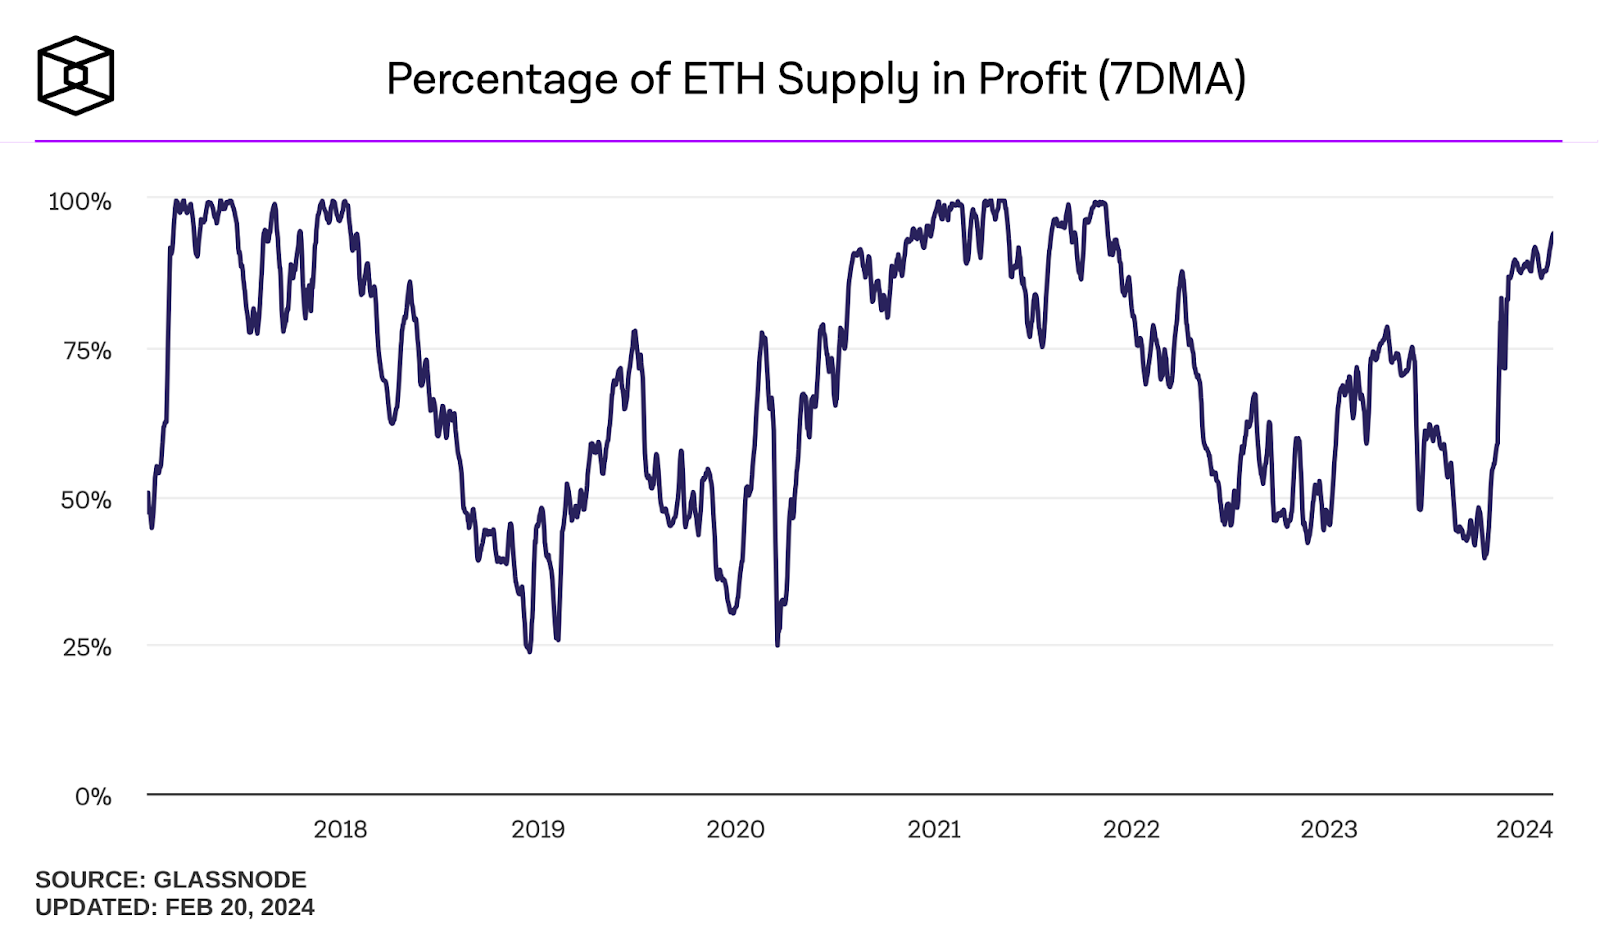
In conclusion, it is considered appropriate to show this analysis that indicates the number of on-chain Ethereum addresses that hold an average purchase price lower than the current prices, therefore they are in profit.
It is worth noting how from November onwards the percentage of profitable addresses compared to the total network has skyrocketed, going from 40% to the current 94%.
This means that 94 out of 100 addresses have a positive PNL compared to their purchase price and could potentially unload their positions at any moment.
Usually in the past, when the percentage of addresses in gain has reached this value, very violent selling sessions have followed which have led to a sharp drop in the price of ETH.
However, it is worth noting that this value remained high for several months during the previous bull market, so in this case too we may see a long time pass before the storm arrives.