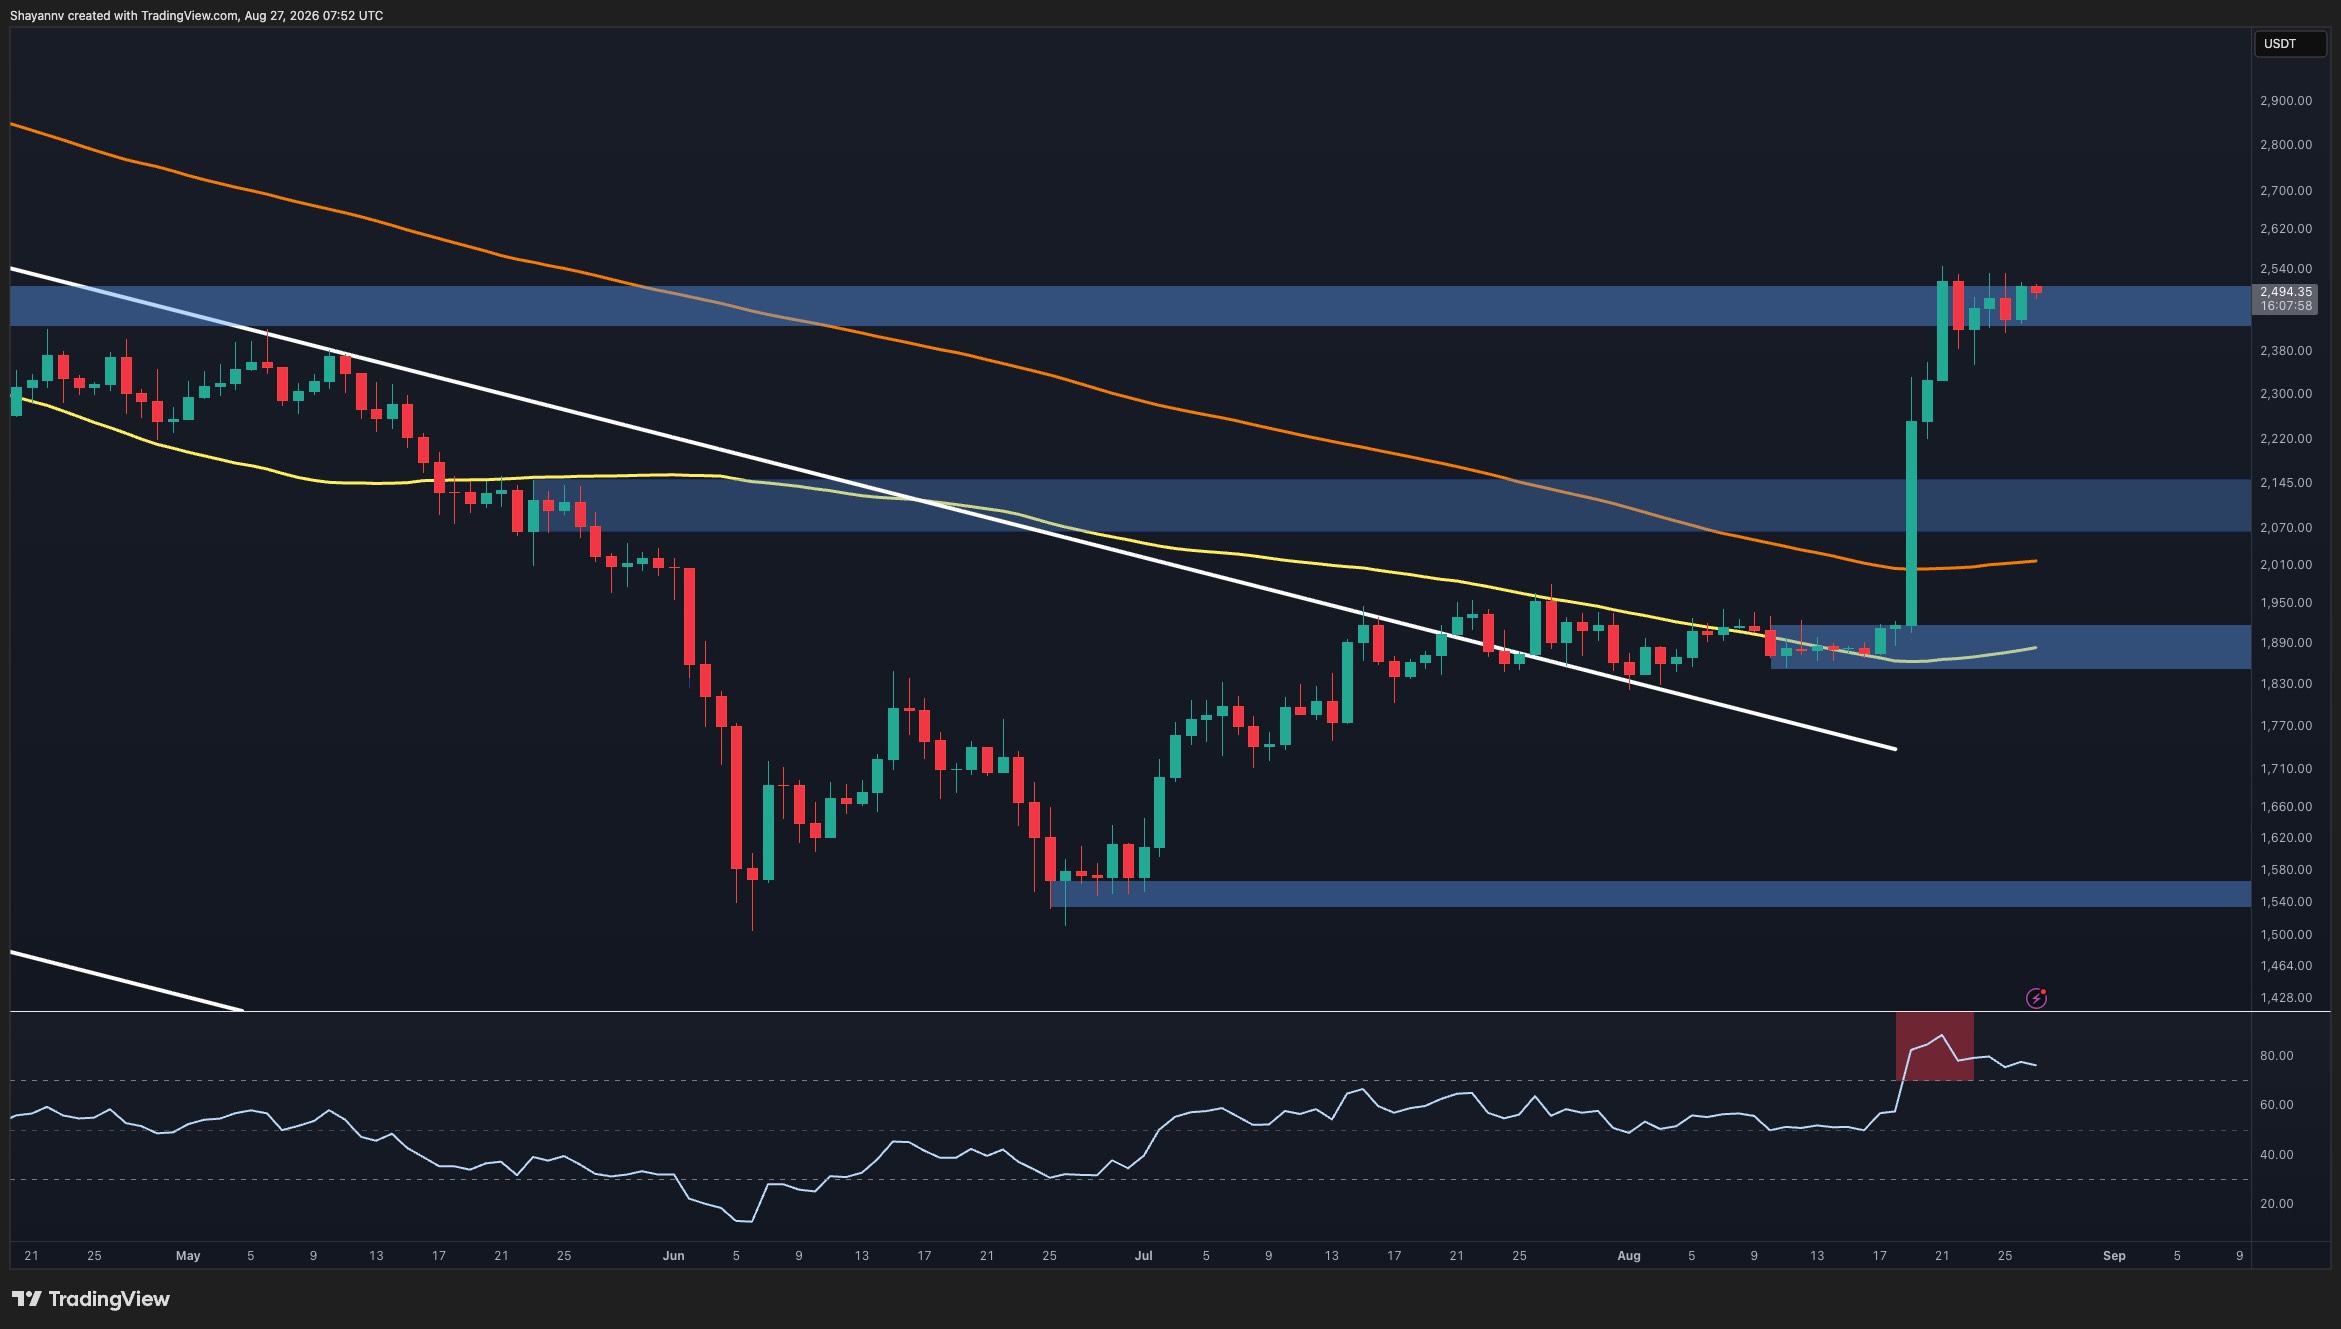
Ethereum has surged approximately 35% from its $1.85K-$1.92K support zone, breaking through the descending trendline, major moving averages, and the $2.07K-$2.15K resistance zone with considerable strength. ETH is now testing the $2.4K-$2.5K resistance area on the daily timeframe.
The rally has significantly improved Ethereum's market structure, though technical indicators suggest the advance may be extended. The Relative Strength Index has entered overbought territory following the vertical advance, indicating the market may face consolidation or a corrective pullback if supply increases around current price levels.
Short-Term Technical Picture
On the 4-hour chart, Ethereum has surged nearly vertically from around $1.9K and is consolidating within the $2.43K-$2.51K range. A decisive breakout above $2.51K could signal continued buyer control and open the door to further gains. However, after such an aggressive rally, a retracement would be technically reasonable.
Key support zones include the $2.22K-$2.31K region as a first pullback target, with the $2.07K-$2.12K zone providing secondary support in the event of more substantial selling pressure.
Market Sentiment and Liquidation Levels
Liquidation data reveals that liquidity is present on both sides of Ethereum's current price, indicating neither buyers nor sellers have established complete control. This balanced positioning increases the possibility of sideways consolidation accompanied by liquidity sweeps in both directions, with price potentially testing levels above or below the developing range before establishing its next sustained trend.
The broader momentum remains favorable for bullish continuation, though the path higher may not be straightforward. The market may require a period of consolidation or a temporary pullback to absorb supply following the recent impulsive advance.