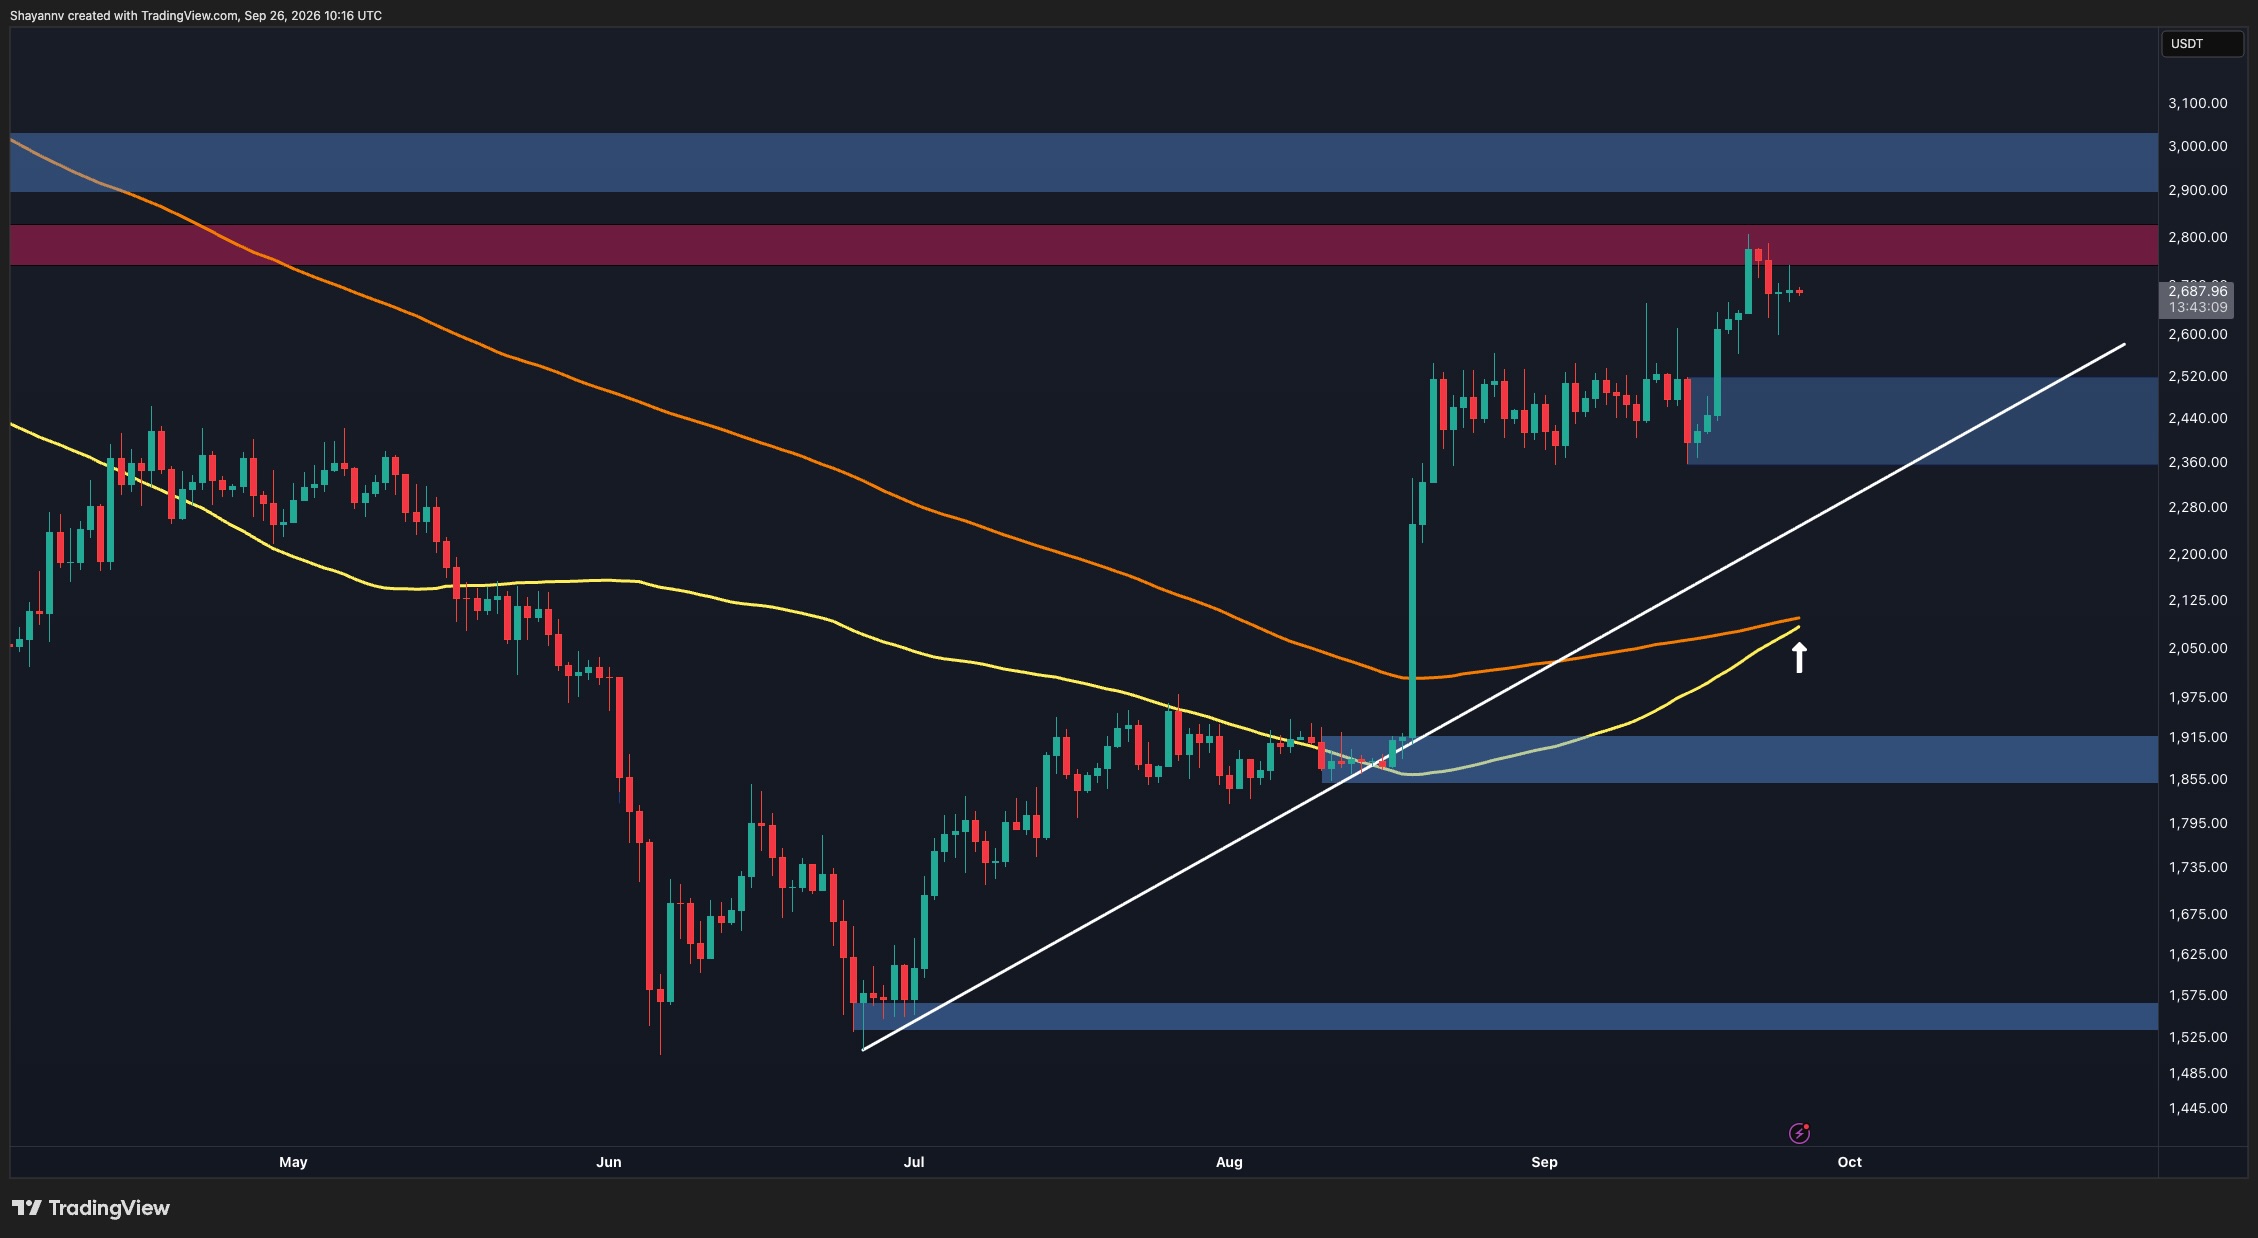
Ethereum is consolidating below $2.7K following rejection from a major resistance zone, while maintaining a broader bullish structure established since an August breakout from the $1.85K-$1.92K demand area.
Daily Chart Structure
On the daily timeframe, ETH has established a sequence of higher lows with an ascending trendline providing structural support. The latest rally pushed the asset into the $2.75K-$2.82K resistance zone, where selling pressure emerged. Rather than correcting significantly, ETH has stabilized around $2.69K, suggesting buyers remain in control.
Two moving averages are converging in a potentially significant development. The faster-moving average is rising sharply toward the slower-moving average around the $2.05K-$2.10K region. A crossover above this level would form a golden cross, providing technical confirmation that medium-term momentum favors buyers. However, this crossover has not yet occurred.
A breakout above $2.75K-$2.82K could open a path toward the next supply area around $2.90K-$3K. The $2.36K-$2.52K zone, reinforced by the rising trendline, represents key support if a deeper pullback develops.
Short-Term Price Action
The 4-hour chart shows ETH compressing beneath the $2.75K-$2.82K resistance. After briefly dipping to $2.63K, the asset recovered and entered tight consolidation around $2.68K-$2.70K. The rising trendline connecting recent higher lows is gradually approaching price, creating a tightening structure between ascending support and overhead resistance.
A confirmed breakout above $2.82K would strengthen the continuation scenario toward $2.90K-$3K. A loss of the ascending trendline could trigger a deeper correction initially toward the $2.43K-$2.49K demand zone, with the $2.21K-$2.28K support area becoming relevant further down.
Liquidity Positioning
Liquidation data shows significant concentrations of leveraged positions on both sides of the current price. A particularly dense liquidation cluster has formed around $2.78K-$2.82K, closely overlapping with technical resistance. A breakout above this level could amplify the move as short positions are forced to close.
On the downside, substantial liquidity pools near $2.60K-$2.62K mean that failure to break higher could draw price toward this region first. Ethereum remains effectively caught between downside liquidity near $2.6K and a larger overhead cluster around $2.8K.