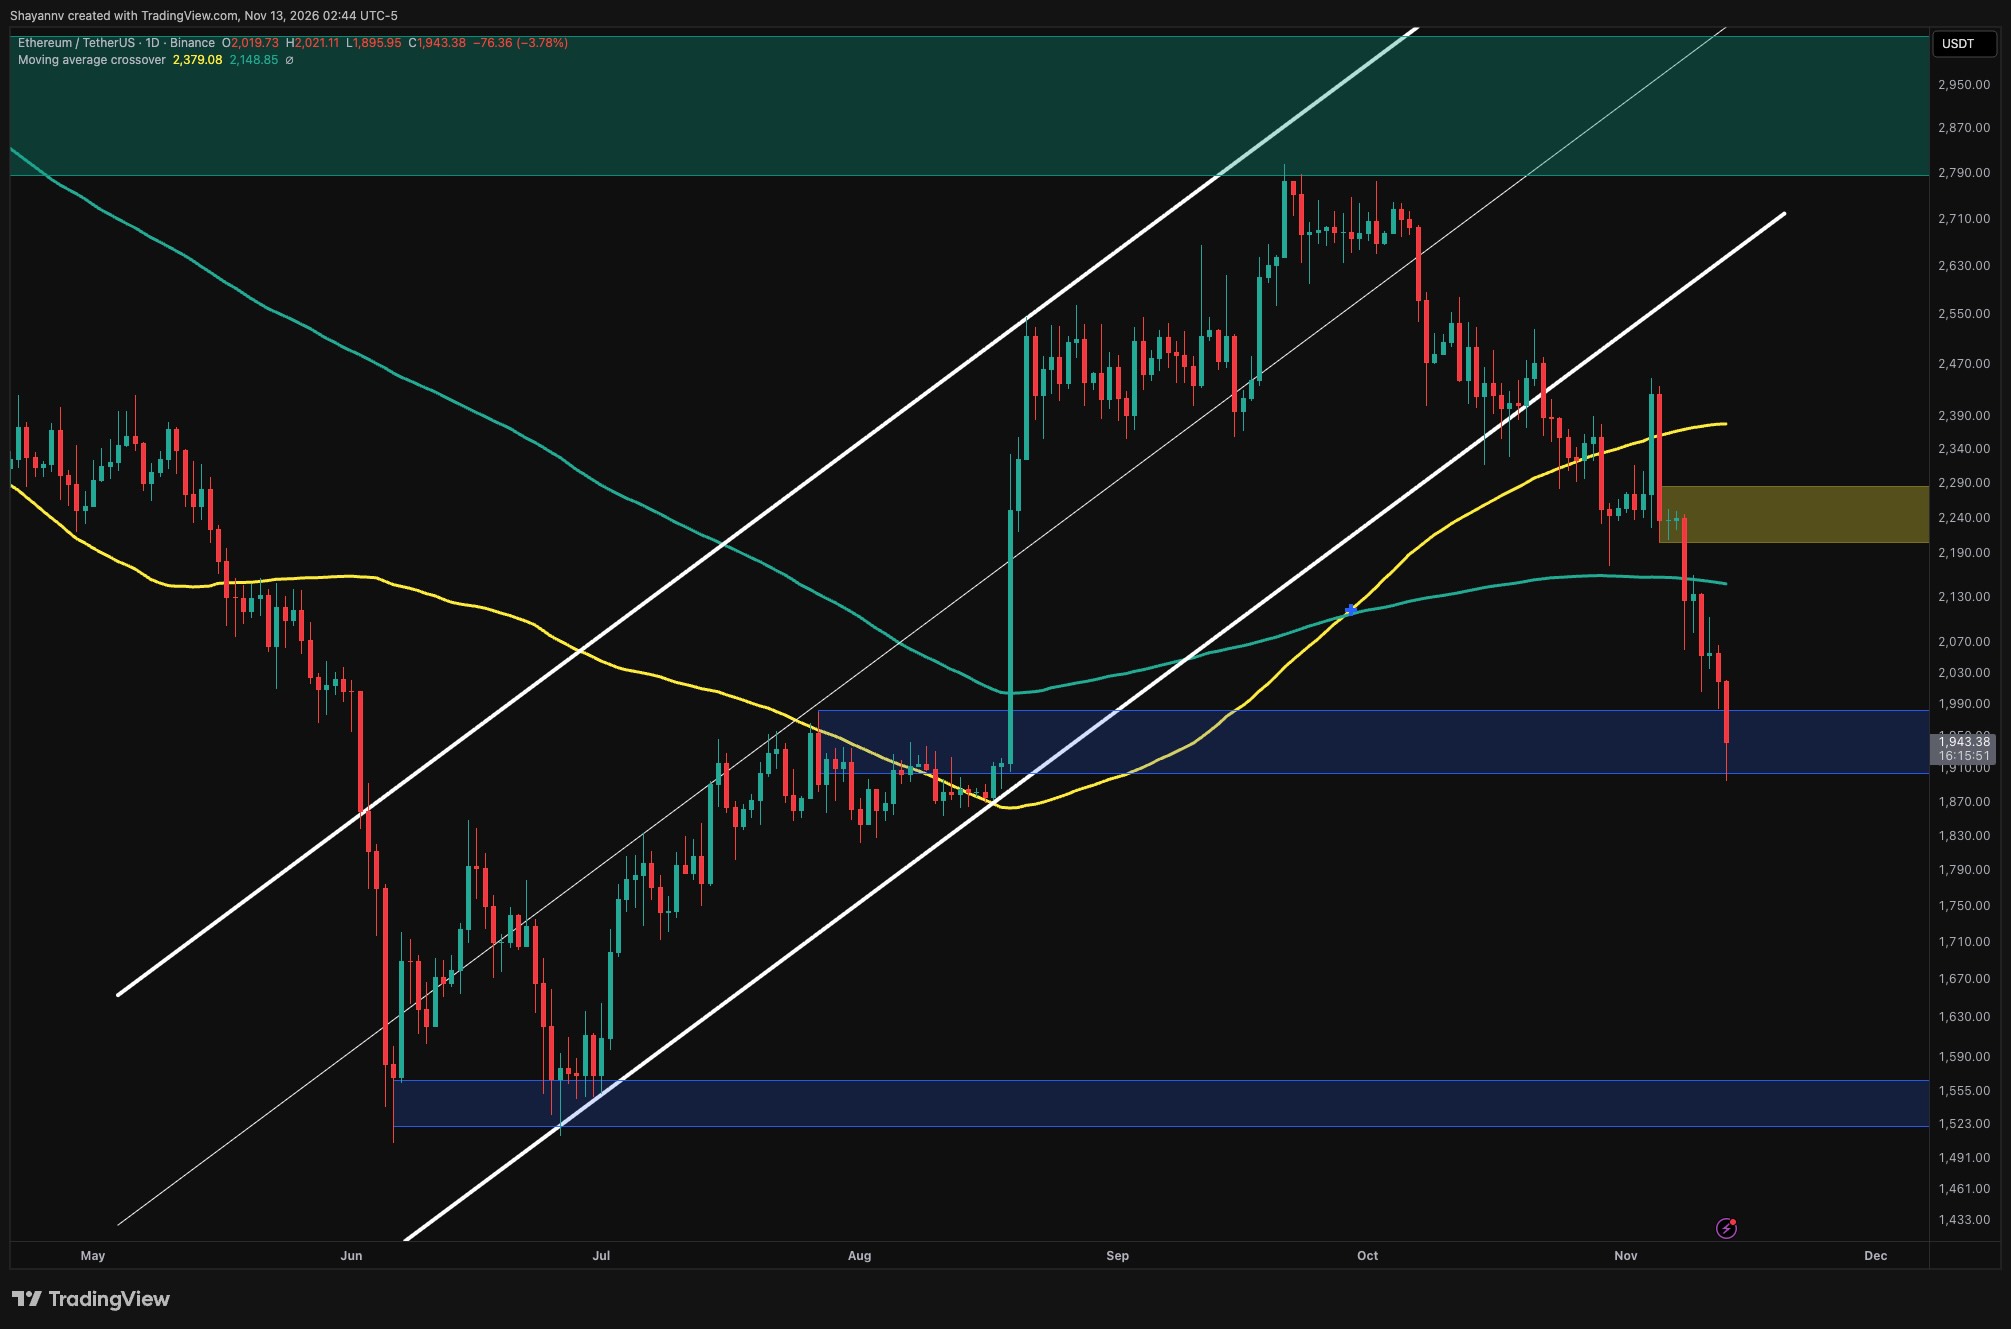
Ethereum has declined below $2,000 and entered a major demand zone between $1.90K and $1.98K, according to technical analysis. The price briefly dipped beneath $1.90K intraday before stabilizing near $1.94K.
Daily Chart Analysis
The daily chart shows Ethereum extending its decline after breaking below an ascending channel. The cryptocurrency now trades below both of its displayed moving averages, currently positioned around $2.15K and $2.38K. While these averages previously showed a bullish crossover, the subsequent price breakdown has not produced sustained upside momentum, and they now represent potential recovery hurdles.
The $1.90K–$1.98K demand zone overlaps with a consolidation area that preceded August's advance. A sustained daily close beneath $1.90K would weaken this support zone and expose deeper lows around $1.83K–$1.87K. The next marked support lies near $1.52K–$1.57K.
Four-Hour Chart Observations
The four-hour chart shows an acceleration in selling pressure after Ethereum broke beneath a descending channel's lower boundary. A rebound toward $2.04K–$2.10K failed, establishing that area as near-term supply. The latest candles display a modest reaction from approximately $1.90K, but a sequence of lower highs and lower lows remains intact.
Recovery through $1.98K–$2K would represent the first stabilization signal, while reclaiming $2.04K–$2.10K would indicate easing of immediate selling pressure. Any bounce remains vulnerable to rejection until those levels are recovered.
Liquidation Concentration
Liquidation data shows prominent estimated liquidation exposure concentrated beneath the current price around $1.80K–$1.86K. This area represents potential downside risk if Ethereum fails to defend the daily demand zone. A move into this concentration could trigger additional long liquidations and amplify volatility.
Above the market, liquidation concentrations appear around $1.94K–$1.98K and farther overhead near $2.10K–$2.20K. A sustained recovery through $2K could bring higher bands into focus and potentially accelerate a rebound.