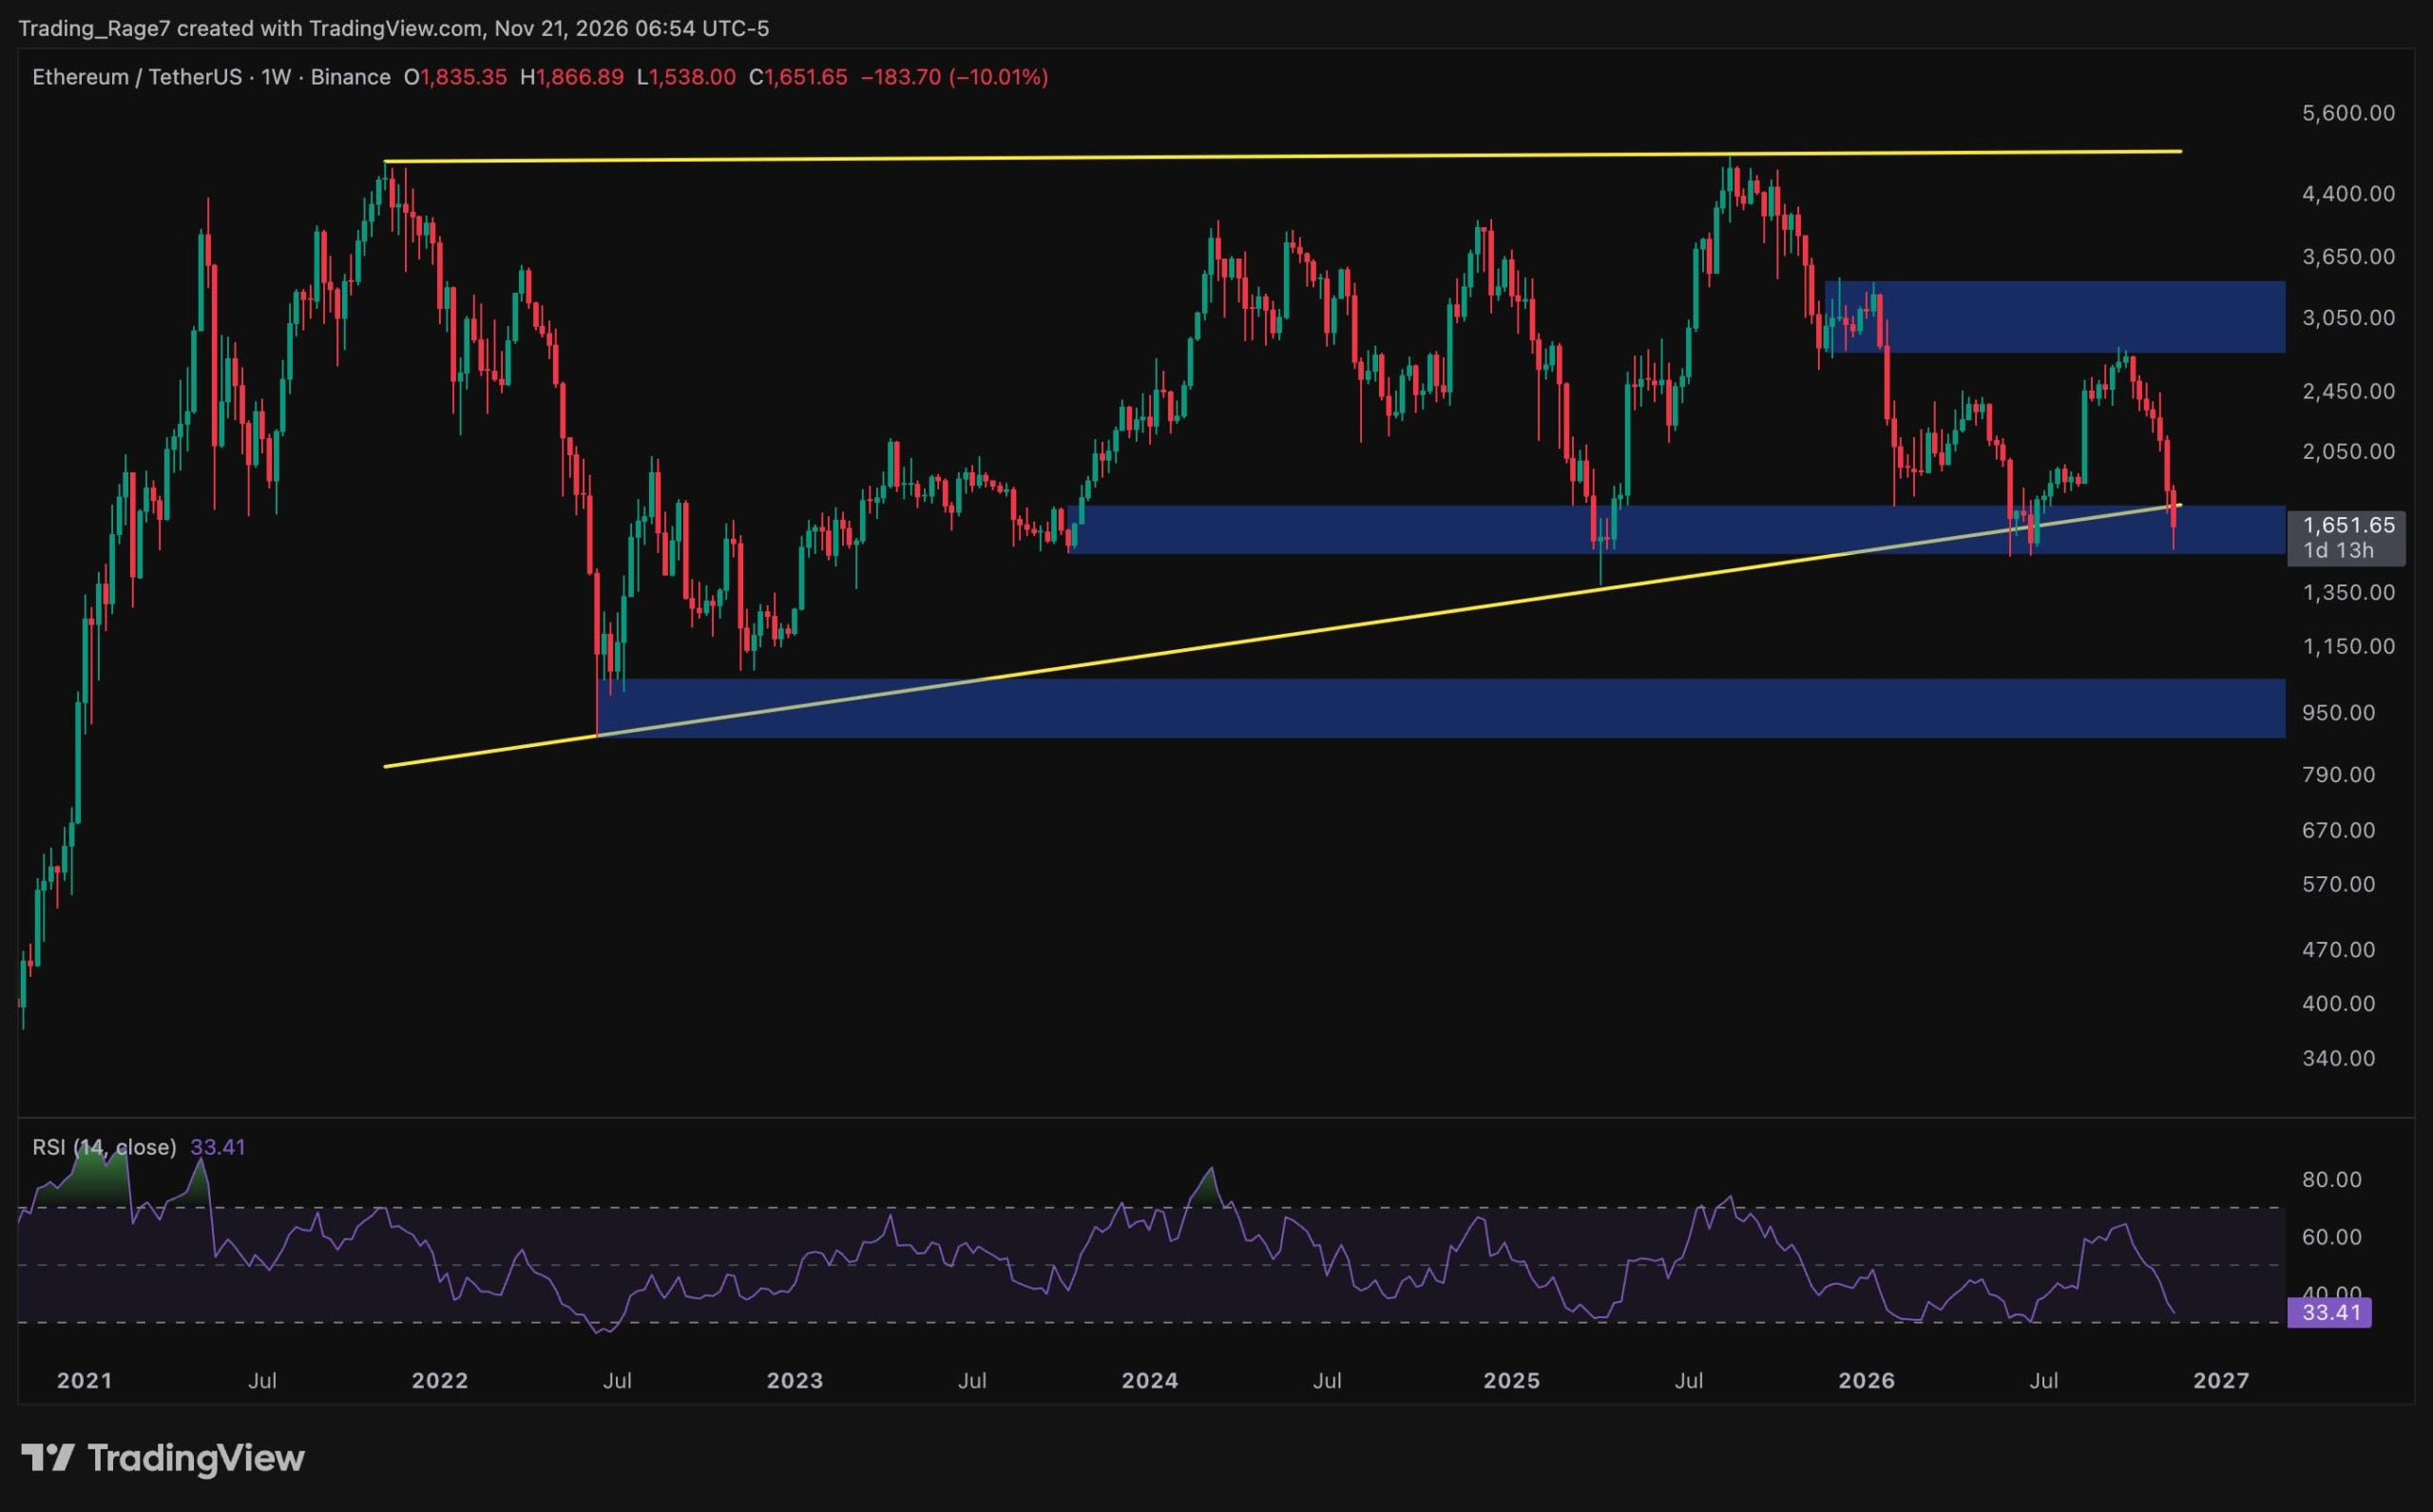
Ethereum extended its decline this week, dropping below $1.6K before recovering toward $1.65K. The sell-off occurred alongside a broader crypto market retreat driven by spot ETF outflows and hawkish Federal Reserve rate-hike expectations, along with weakness in AI-related equities. Bitcoin fell below $56,000, and more than $2.4 billion in leveraged positions were liquidated over 24 hours.
ETH is now testing a key multi-year support zone while long liquidations have climbed to their highest levels in months.
Weekly Chart Analysis
On the weekly timeframe, Ethereum trades within a broad structure bounded by resistance near $4.9K all-time highs and a rising trendline from the 2022 bear-market low. After failing to reclaim the $2.8K–$3.3K supply zone in October, ETH has declined steadily, with this week's 10% drop bringing the price back to the long-term trendline.
The critical zone now sits between $1.5K and $1.75K, which served as the base for major rallies in 2023 and 2025 and held again in summer 2026. The current candle wicked down to around $1.54K before buyers pushed the price back above $1.6K. If this zone holds, ETH could attempt a recovery toward $2K, with the $2.8K–$3.3K supply zone as the next major hurdle. A decisive weekly close below $1.5K would break both the demand zone and the trendline, exposing the $0.9K–$1K region at the base of the 2022 bottom.
The weekly RSI has dropped to approximately 33, near the oversold threshold of 30. Comparable readings appeared near the mid-2022, April 2025, and June 2026 lows, all of which preceded significant rebounds. However, the indicator has not yet turned higher, and a move back above 50 would be needed to signal a shift in momentum.
Short-Term Structure
The 4-hour chart shows a descending channel that has guided the price lower since the rejection near $2.4K in early November. ETH consolidated around the $1.8K support for several sessions before that floor gave way and the sell-off accelerated into both the channel's lower boundary and the $1.5K demand zone.
The rebound from these lows has carried ETH to approximately $1.65K, right at the edge of a bearish fair value gap around $1.7K. A push through this imbalance and the channel's upper boundary would open the way toward $1.8K, likely to act as resistance. If the bounce fails, a retest of $1.5K becomes probable, and losing it would shift focus to weekly levels below.
The 4-hour RSI has recovered from a deeply oversold reading near 22 to approximately 37, suggesting short-term selling pressure is easing. However, momentum remains below the neutral 50 level, so the recovery still lacks confirmation.
Liquidation Levels
Long liquidations have risen sharply from about 20K in September to approximately 32.5K, their highest reading since spring 2026, as ETH slid from around $2.8K to $1.6K. Earlier liquidation spikes in February and April 2026 came close to local price lows, flushing out excess leverage and reducing exposed positions. However, those flushes were followed by months of range-bound trading rather than immediate recoveries, and the current reading is still climbing rather than rolling over.
The $1.5K and $1.7K levels represent key triggers to watch for both support and potential liquidation cascades.