 Price Analysis for November 16")
Disclaimer: The opinions expressed by our writers are their own and do not represent the views of U.Today. The financial and market information provided on U.Today is intended for informational purposes only. U.Today is not liable for any financial losses incurred while trading cryptocurrencies. Conduct your own research by contacting financial experts before making any investment decisions. We believe that all content is accurate as of the date of publication, but certain offers mentioned may no longer be available.
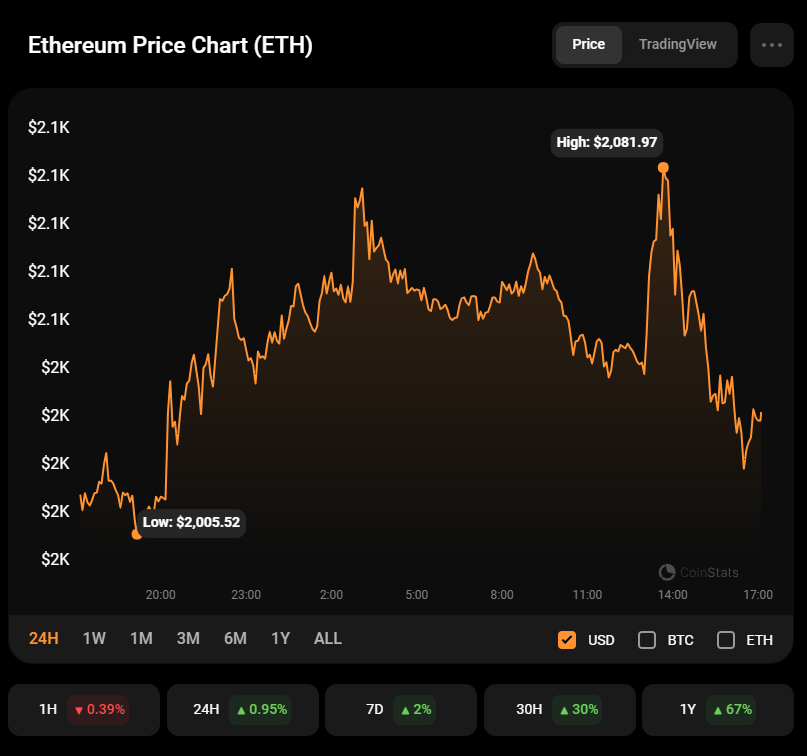
The market is facing bearish pressure; however, some coins keep rising, according to CoinStats.
ETH/USD
The rate of Ethereum (ETH) has risen by almost 1% since yesterday.
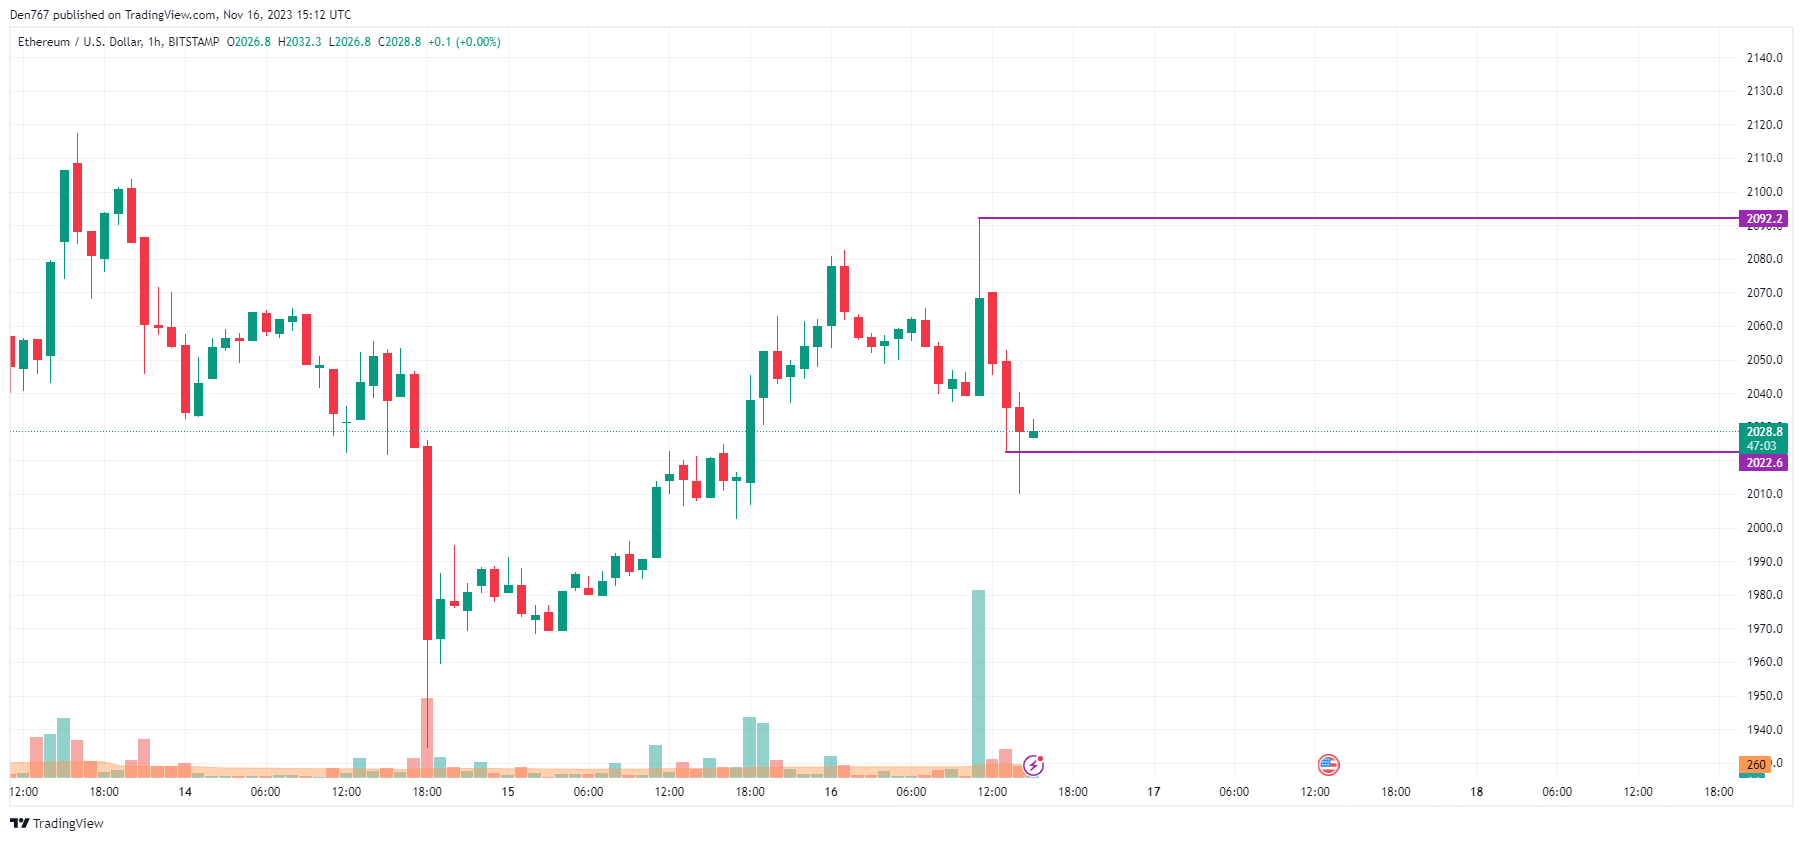
On the local chart, the price of ETH has made a false breakout of the support level of $2,022. If the daily candle closes far from this mark, the bounce back may happen to the interim zone of $2,050 tomorrow.
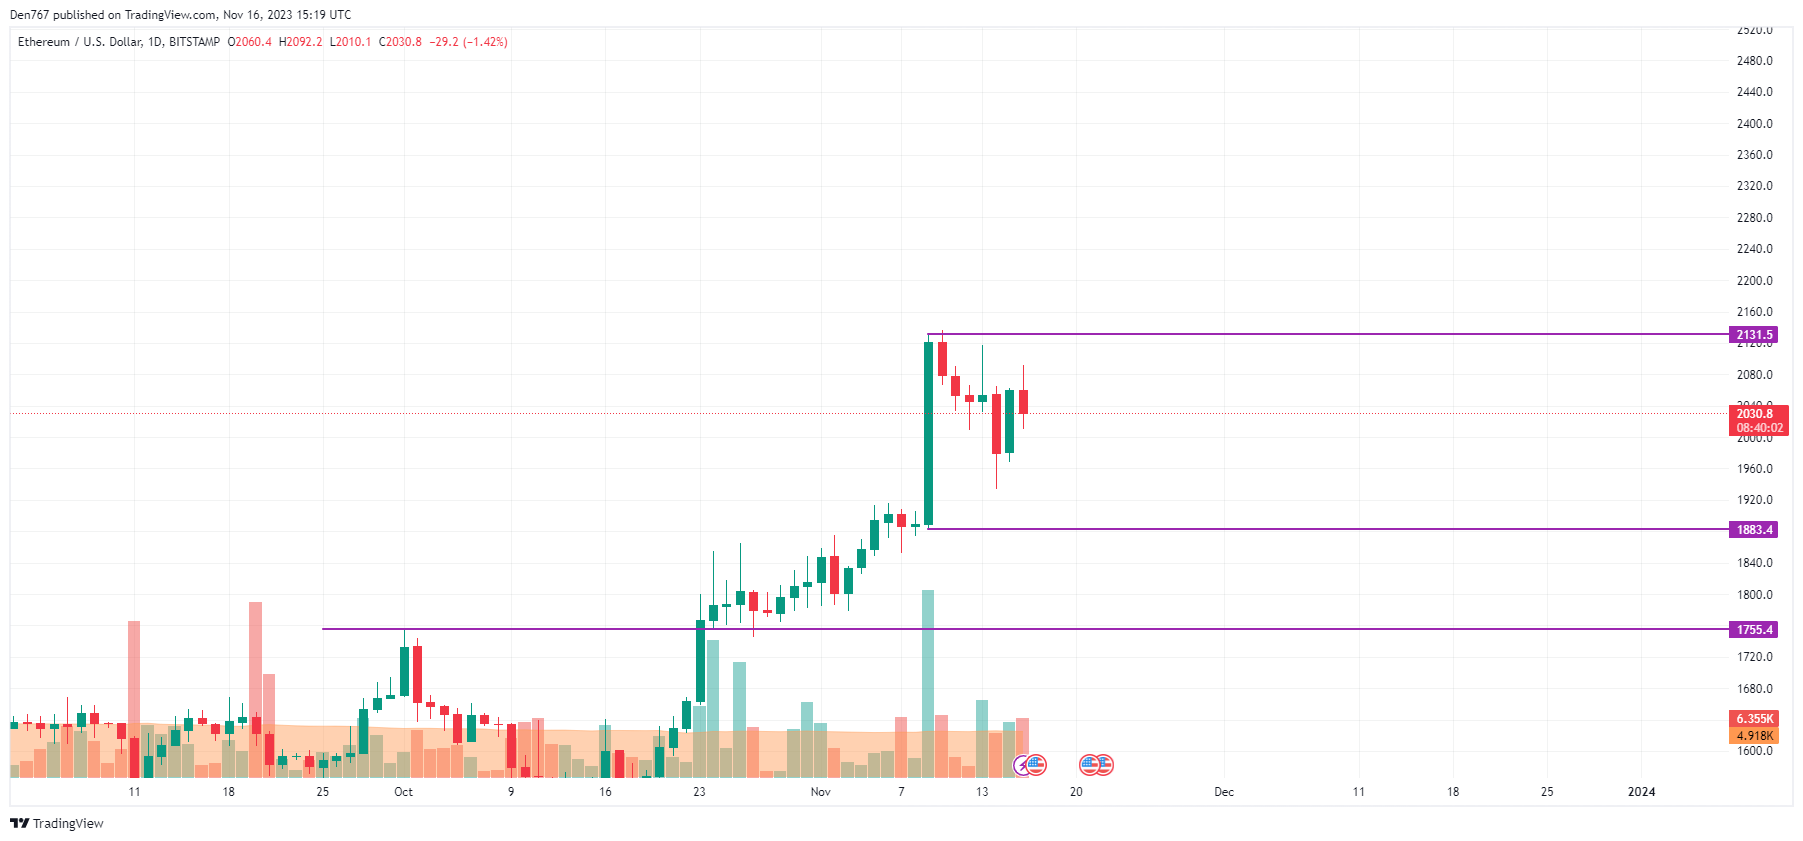
Today’s bearish candle has not affected the technical picture on the daily time frame.
As none of the sides is dominating, ongoing sideways trading in the area of $2,000-$2,100 is the more likely scenario for the current week.
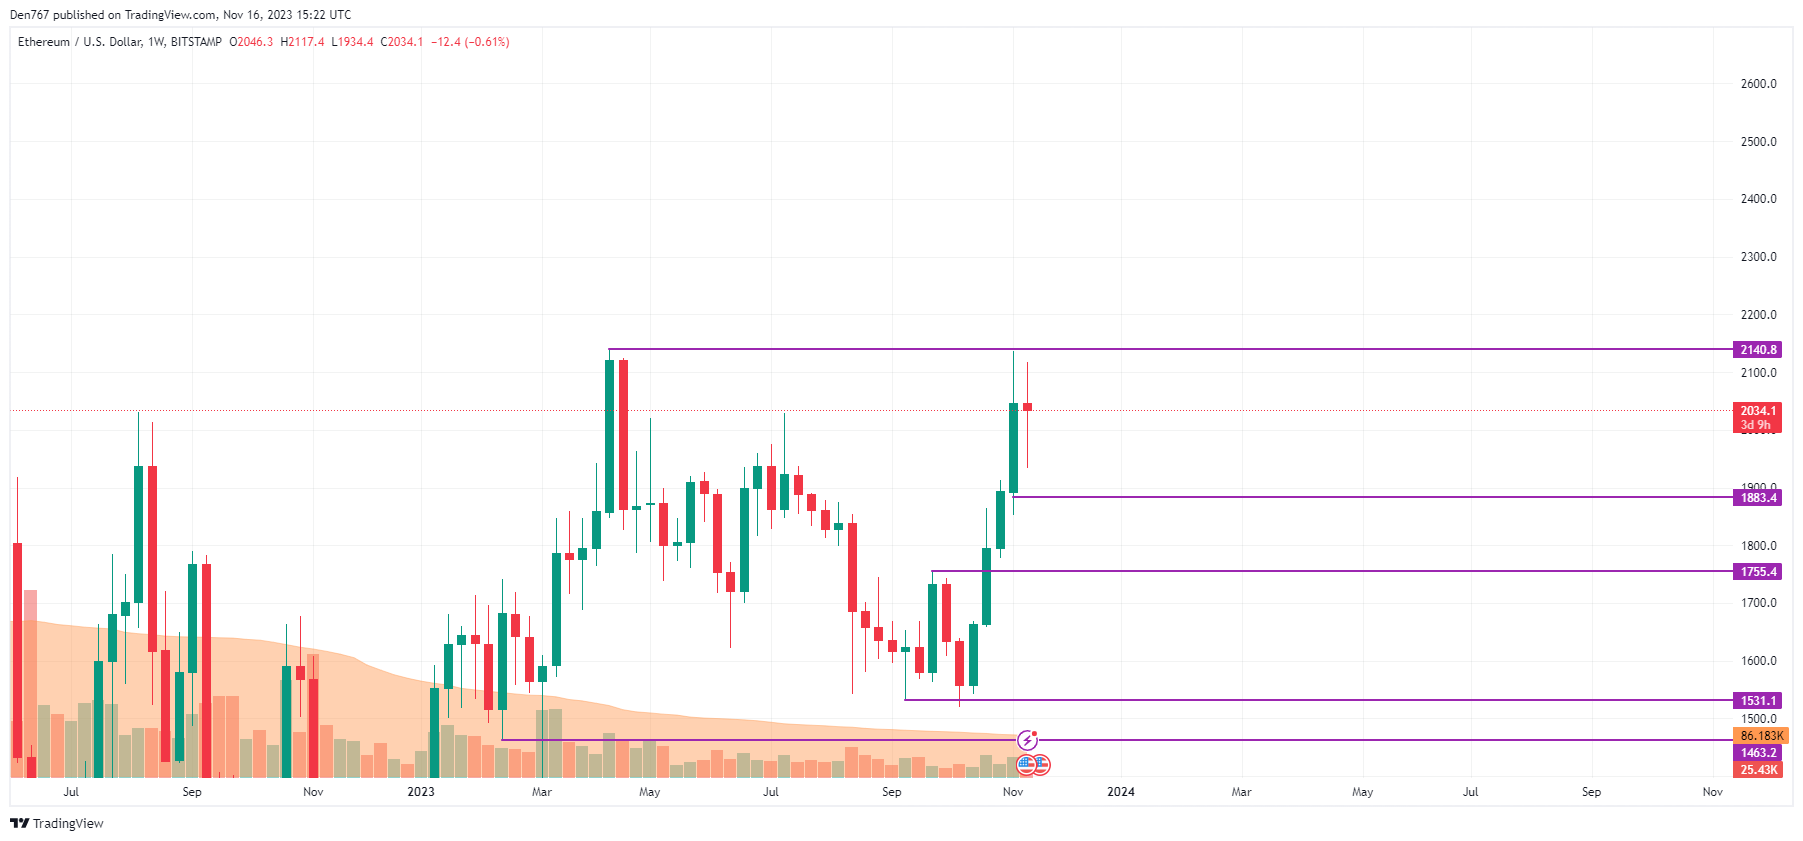
A similar situation can be seen on the weekly chart. At the moment, one should focus on the important area of $2,000. If the rate of ETH remains above that, there is a possibility to see a further rise to the $2,200 range.
Ethereum is trading at $2,031 at press time.