 Price Jumps Above ,200 – Is ,000 Next?")
The Ethereum (ETH) price has increased swiftly during the past five weeks, culminating with a high of $3,270 today.
Ethereum emerged from long-term horizontal and diagonal resistance levels during the upward movement.
Ethereum Continues Ascent Above $3,000
The weekly time frame technical analysis shows the ETH price has increased swiftly in the past five weeks. Today, ETH reached a high of $3,270, the highest since March 2022.
During the upward movement, the ETH price broke out from its long-term ascending parallel channel and the middle of its long-term range (green circle). This occurred after two previous unsuccessful breakout attempts (red icons). Before the breakouts, the ascending parallel channel had existed since May 2022, while the range had existed since the start of 2021.
The weekly Relative Strength Index (RSI) supports the breakout. When evaluating market conditions, traders use the RSI as a momentum indicator to determine whether a market is overbought or oversold and whether to accumulate or sell an asset.
If the RSI reading is above 50 and the trend is upward, bulls still have an advantage, but if the reading is below 50, the opposite is true. The RSI just moved above 70 (green icon), something that has previously preceded swift price rallies.
Read More: What Is Wrapped Ethereum (WETH)?
What Are Analysts Saying?
Cryptocurrency traders and analysts on X positively view the future Ethereum trend.
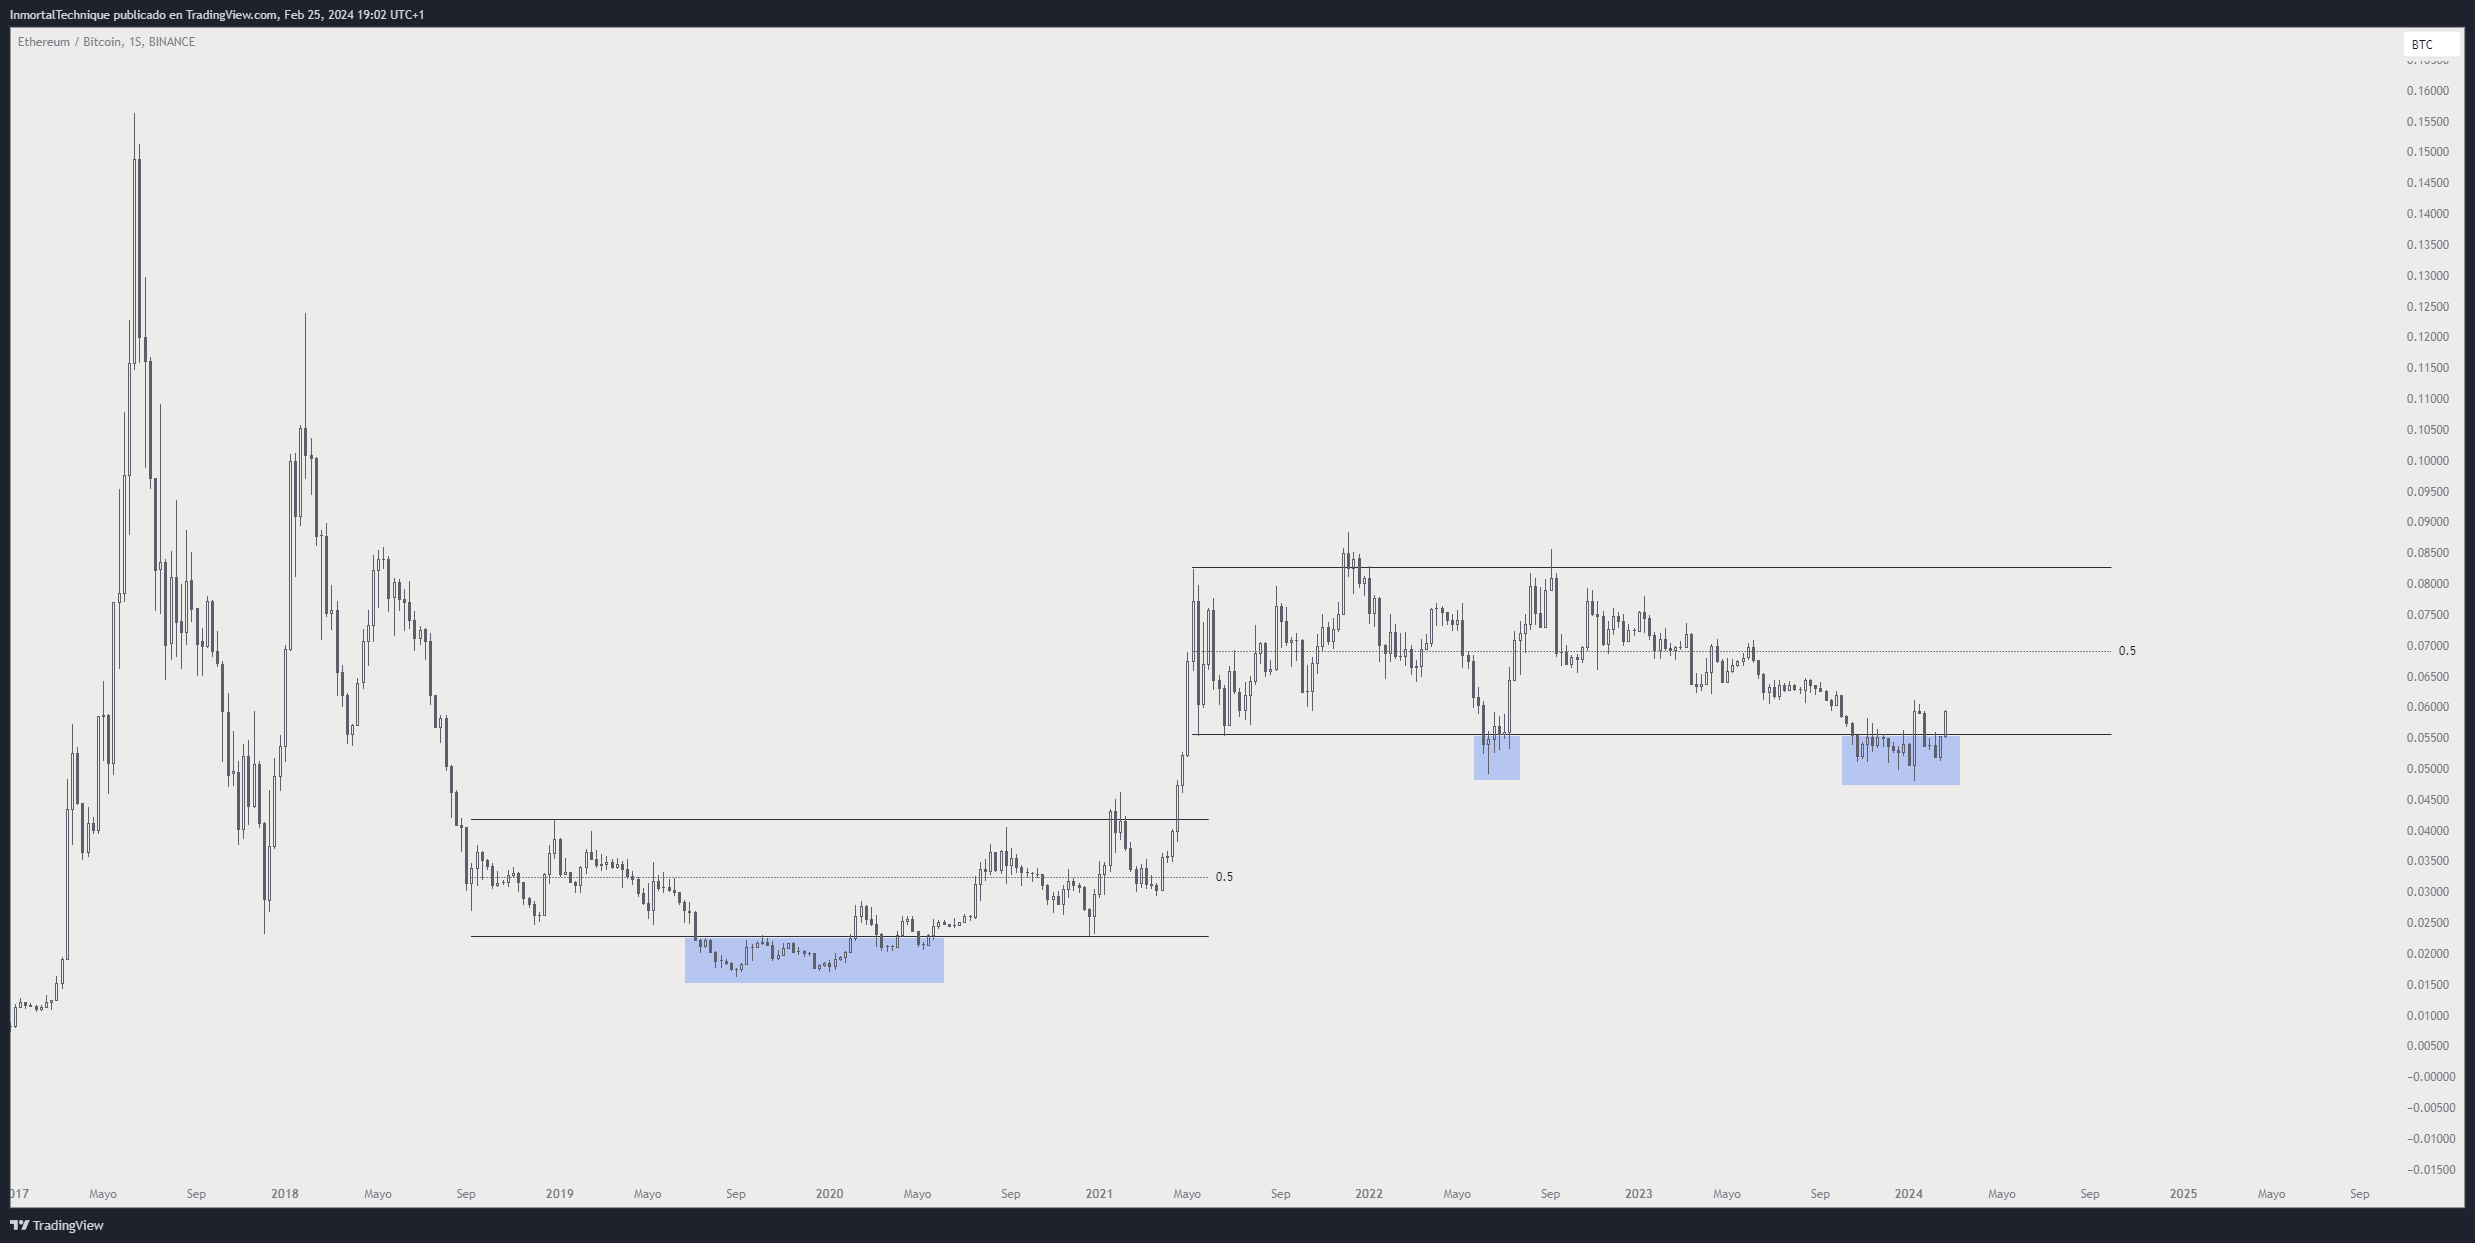
Immortalcrypto believes ETH will greatly outperform Bitcoin soon since it has already deviated below its range low.
Similar outlooks are given by Bob Loukas and MacnBTC, who outline a potential breakout from a descending resistance trend line.
CryptoMichNL outlined his main reasons why he believes ETH will lead against BTC:
“Against $BTC, it’s facing a crucial resistance zone. Two key ingredients: – Dencun upgrade in a few weeks time. – Spot #Ethereum ETF coming up. The breakout above 0.06 BTC will cause a strong breakout on the entire Ethereum ecosystem.” He stated.
Read More: Ethereum (ETH) Price Prediction 2024/2025/2030
ETH Price Prediction: Where to Next?
The ETH/BTC chart shows bullish signs similar to the USD chart. The ETH/BTC price deviated below the middle of its range at the end of 2023. Afterward, the weekly RSI generated a bullish divergence, and the ETH price increased in 2024.
Currently, it is in the process of breaking out from a descending resistance trend line and the middle of its range. If successful, ETH can increase by 35% and reach the top of the range at ₿0.078. A similar increase to $4,000 would be likely in the ETH/USD pair.
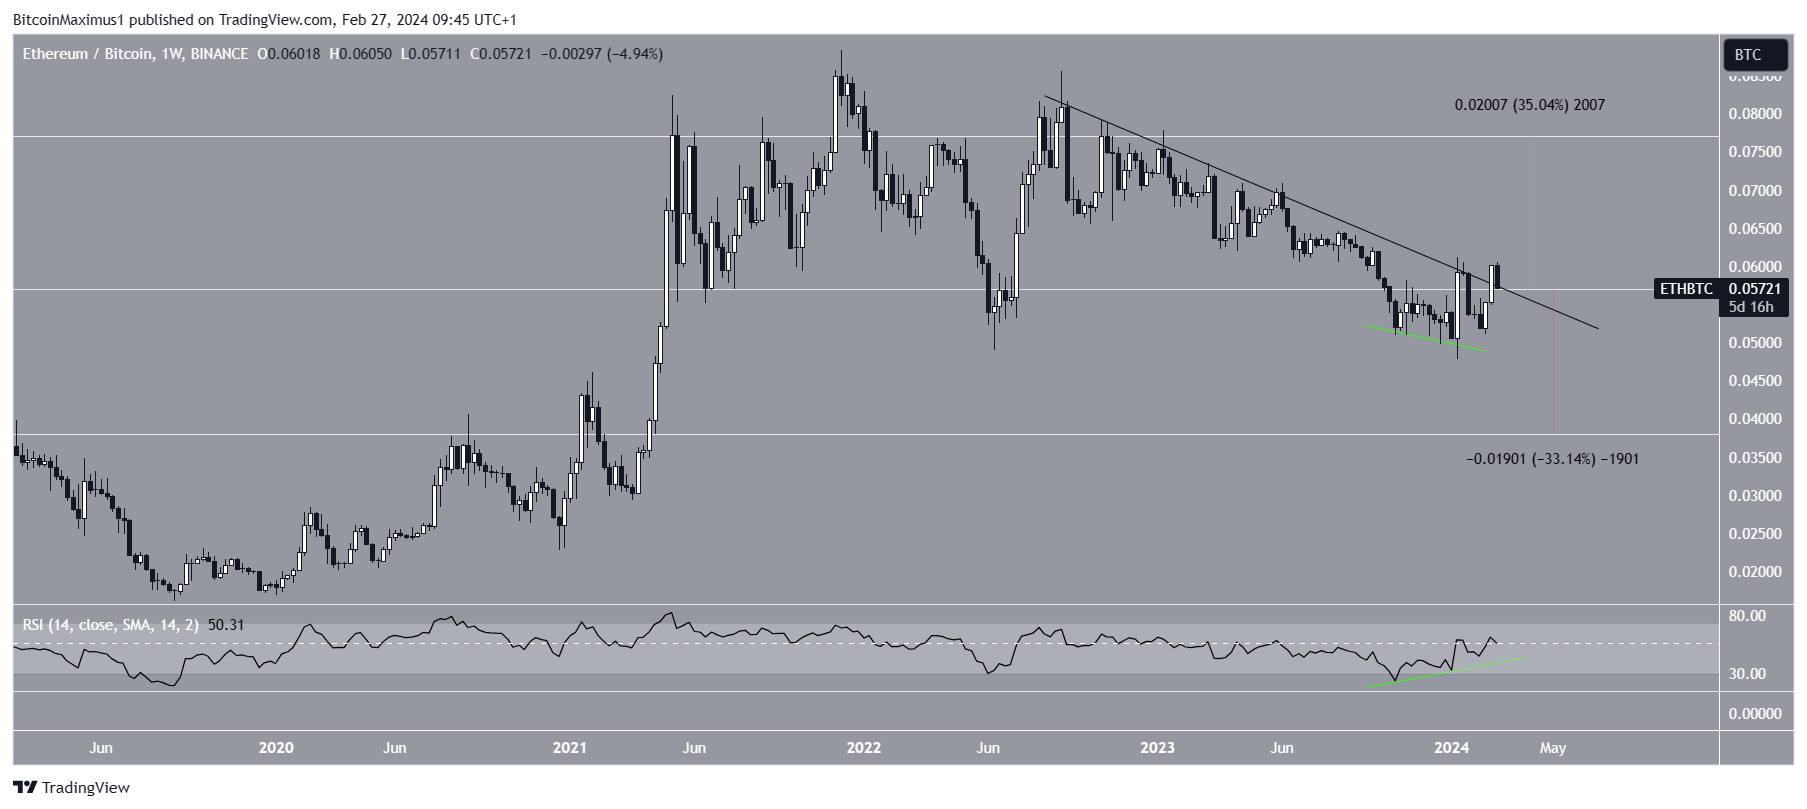
Despite the bullish ETH price prediction, a weekly close below the trend line and the middle of the range will invalidate the breakout. Then, ETH could fall 33% to the range low of ₿0.038.
In the ETH/USD pair, this could cause a drop to the middle of the channel at $2,500.
Read More: What is Ethereum Restaking?
For BeInCrypto‘s latest crypto market analysis, click here.
The post Ethereum (ETH) Price Jumps Above $3,200 – Is $4,000 Next? appeared first on BeInCrypto.