 Price Reaches Highest Weekly Close in a Year – What Lies Ahead?")
The Ethereum (ETH) price reached its highest weekly close since April 2022 last week and then moved above $3,000 this week.
Will this increase take Ethereum to an all-time high, or will the price fail to sustain it? Let’s find out!
Ethereum Clears Long-Term Resistance
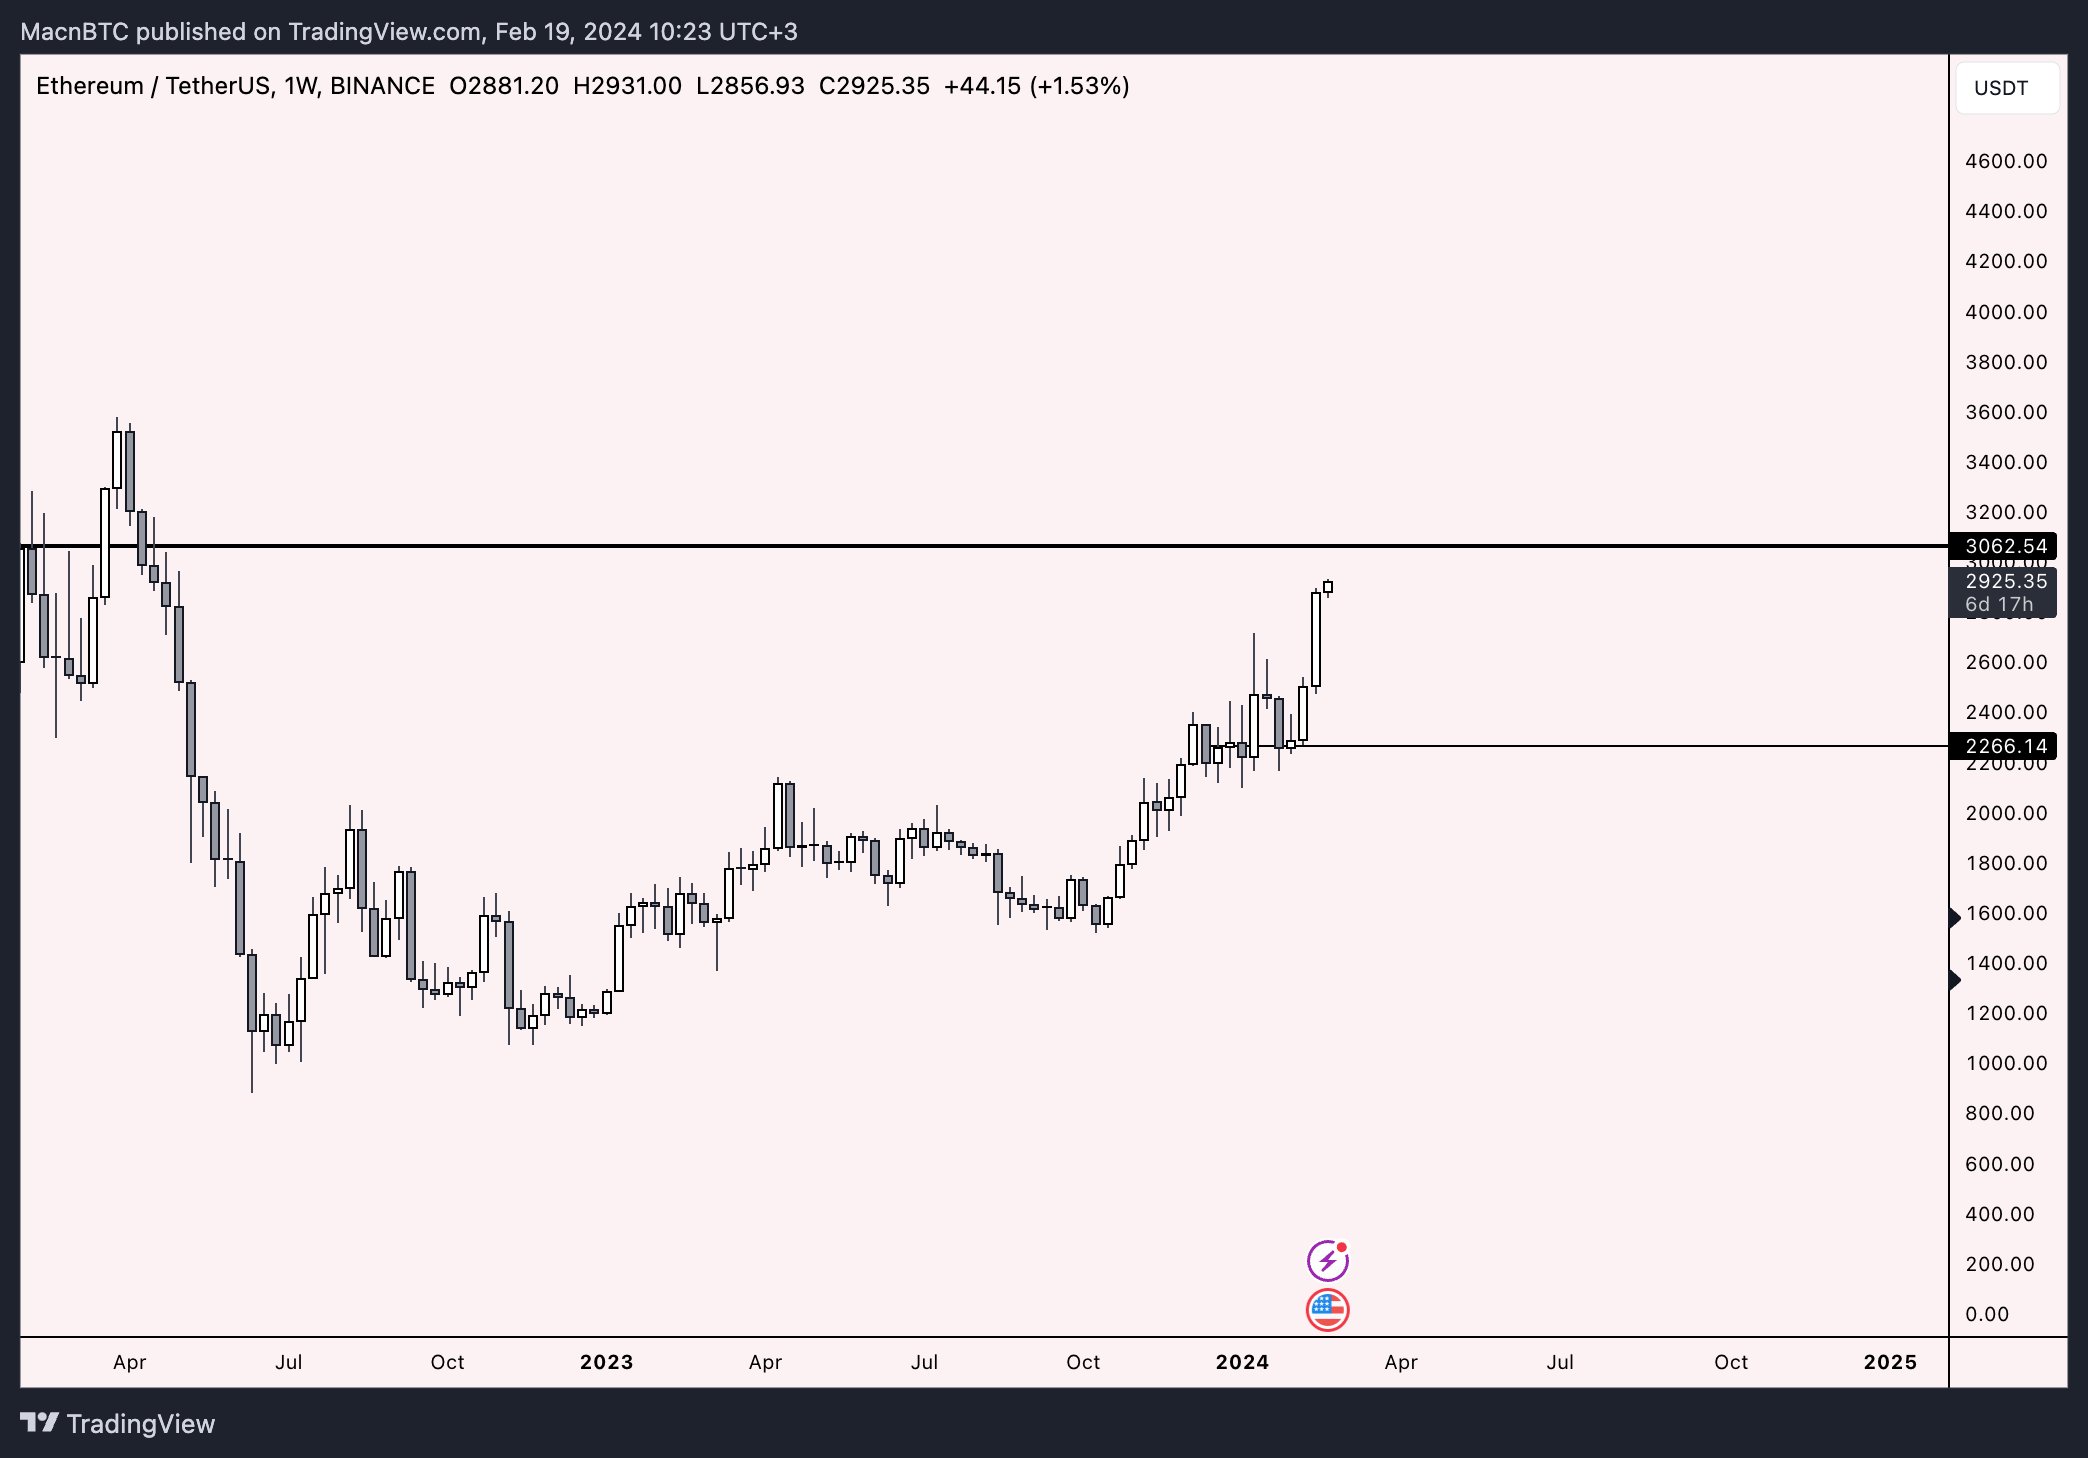
The weekly time frame technical analysis shows the ETH price has increased significantly during the past two weeks, creating a large bullish weekly candlestick. This was especially visible last week.
The upward movement of Ethereum caused the first weekly close above a long-term horizontal area, which has intermittently acted as resistance and support since April 2021. ETH reached a high of $3,032 today, the highest since April 2022.
The weekly Relative Strength Index (RSI) supports the ongoing upward movement. Traders utilize the RSI as a momentum indicator to assess whether a market is overbought or oversold and whether to accumulate or sell an asset.
If the RSI reading is above 50 and the trend is upward, bulls still have an advantage, but if the reading is below 50, the opposite is true. The indicator increased above 70, indicating the bullish trend is heating up.
Read More: What Is Wrapped Ethereum (WETH)?
What Are Analysts Saying?
Cryptocurrency traders and analysts on X positively view the future Ethereum trend.
MacnBTC noted that there is barely any resistance above $3,050.
CryptoMichNL believes a rotation toward the Ethereum ecosystem is underway.
“The gameplan for the coming period: – Survive a potential #Bitcoin correction, as Bitcoin is at the end of this run and probably consolidating. – Rotate as much towards the #Ethereum ecosystem. Hold for 1-2 months and then wait in cash until correction is over”. He stated
Eliz883 believes the $3,100 level is key, and a breakout above it can trigger a significant upward movement, while InmortalCrypto suggests ETH will outperform SOL in the near future.
Read More: What is EigenLayer?
ETH Price Prediction: What’s Next After $3,000?
The wave count from the weekly time frame suggests the increase will continue. Utilizing the Elliott Wave theory, technical analysts examine long-term price patterns and investor psychology that recur to determine the direction of a trend.
The most likely wave count suggests that the ETH price is in wave three of a five-wave upward movement. The sub-wave count is in black, suggesting the price is in the final sub-wave.
The breakout from the ascending parallel channel supports the possibility of this being the right count.
If the breakout continues, ETH can increase by another 16% and reach the 0.618 Fib retracement resistance level at $3,400.
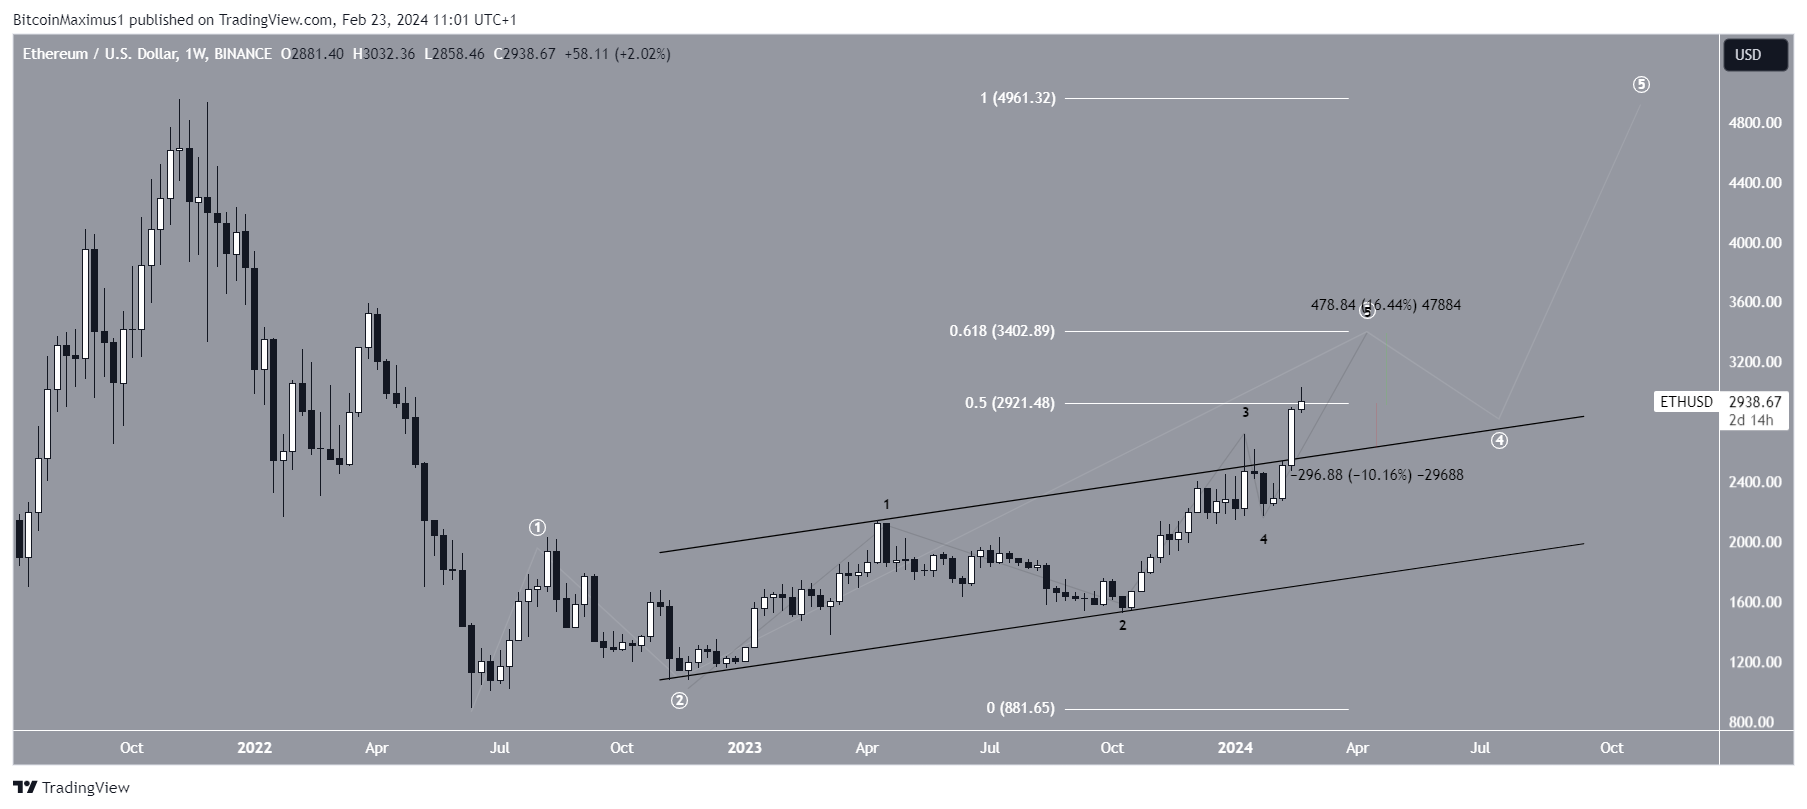
Despite the bullish ETH price prediction, failure to close above the 0.5 Fib retracement resistance level at $2,920 can trigger a 10% drop to the channel’s resistance at $2,630.
Read More: What is Ethereum Restaking?
For BeInCrypto‘s latest crypto market analysis, click here.
![]()
AlgosOne
AlgosOne” target=”_blank”>Explore →
![]()
Coinrule
Coinrule” target=”_blank”>Explore →
![]()
Coinbase
Coinbase” target=”_blank”> Explore →
![]()
PrimeXTB
PrimeXTB” target=”_blank”>Explore →
![]()
BYDFi
BYDFi” target=”_blank”>Explore →
![]()
Сoinex
Сoinex” target=”_blank”>Explore →
The post Ethereum (ETH) Price Reaches Highest Weekly Close in a Year – What Lies Ahead? appeared first on BeInCrypto.