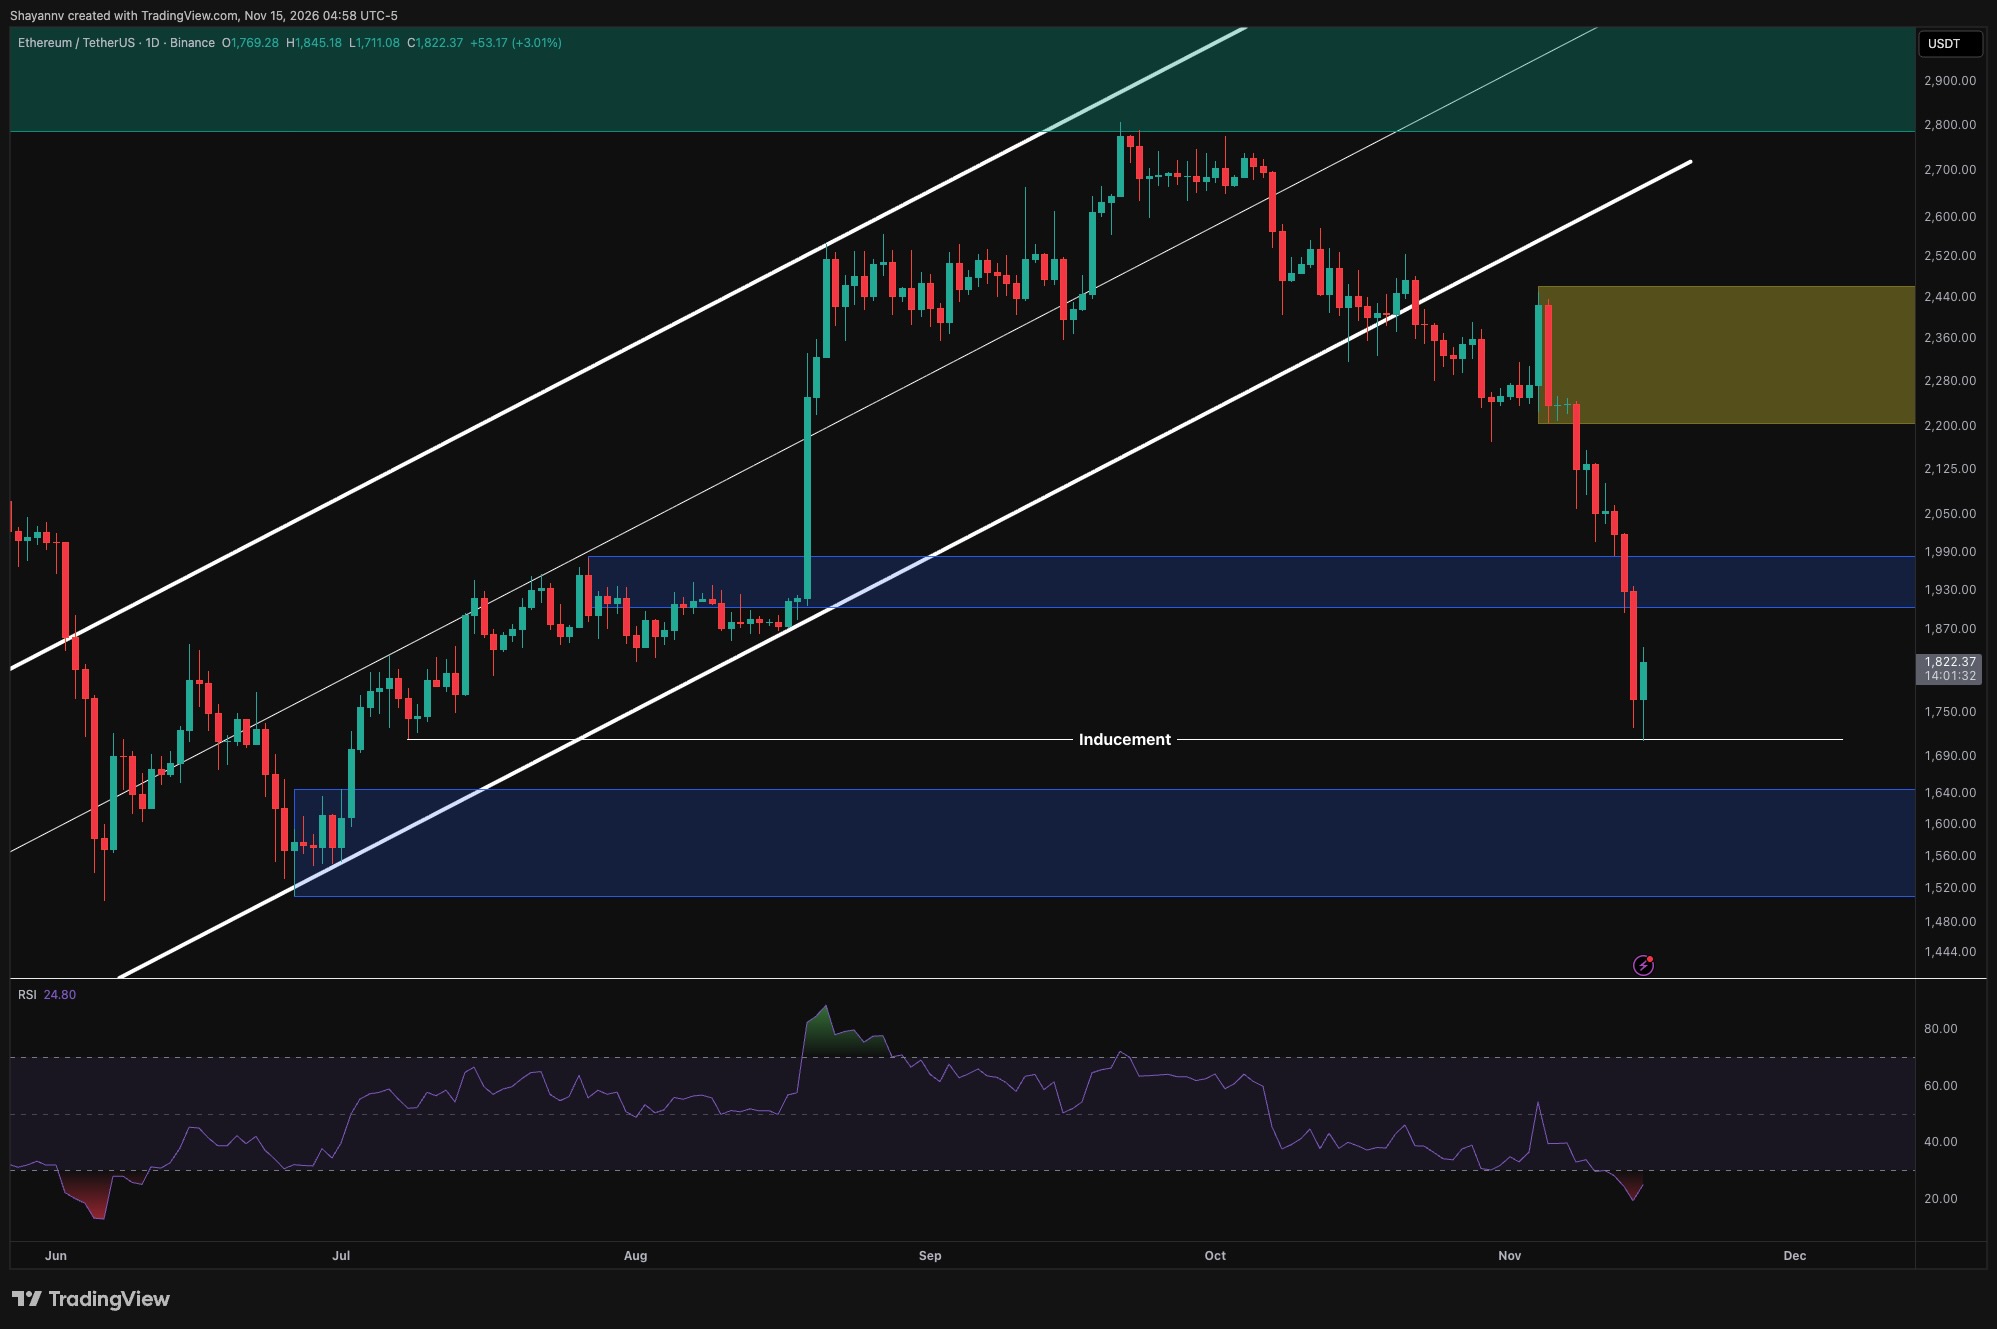
Ethereum has rebounded toward $1.82K following a sharp selloff that reached the $1.71K liquidity level. Daily momentum indicators are oversold, suggesting potential room for a corrective bounce, though the broader bearish structure remains in place.
Daily Chart Analysis
The daily chart shows ETH extending its decline beneath the former $1.90K–$1.98K demand zone. The loss of this level accelerated selling toward the $1.71K horizontal level, where the latest candle attracted a buying response.
The daily RSI sits near 25, indicating oversold momentum. While this supports the possibility of a corrective bounce following an aggressive decline, it does not establish a durable bottom, as strong downtrends can remain oversold while price continues lower.
The first meaningful recovery hurdle is the broken $1.90K–$1.98K zone, which could now act as resistance. Reclaiming it would ease immediate pressure and improve prospects for a recovery toward $2.05K–$2.13K. The broader supply zone around $2.20K–$2.46K remains considerably higher.
If the current rebound fails and ETH breaks sustainably beneath $1.71K, attention would shift toward the major daily demand zone around $1.51K–$1.64K.
Four-Hour Chart Assessment
The four-hour chart highlights persistent bearish momentum following a breakdown beneath a descending channel. Successive consolidation areas have failed to hold, with the latest selloff carrying Ethereum through $1.90K toward $1.71K before buyers responded.
The rebound toward $1.82K is constructive locally but has yet to break a meaningful prior swing high. The nearby $1.84K–$1.85K area represents the first hurdle, followed by the more important $1.90K–$1.98K resistance zone. A rejection there would preserve the sequence of lower highs and leave another test of the lows in focus.
Sustained acceptance above $1.98K would weaken the immediate bearish continuation setup and expose the $2.06K–$2.13K supply zone. On the downside, losing $1.71K would invalidate the current local defense and increase the relevance of the demand area beginning around $1.64K.
Futures Activity
The Futures Average Order Size chart shows a recent cluster of large whale orders accompanying Ethereum's decline from above $2.2K toward the $1.8K region, indicating larger average futures trade sizes during the latest phase of weakness. This raises the possibility that large participants are contributing to selling pressure through bearish positioning or hedging. However, order size alone does not reveal trade direction or confirm accumulation. Continued large-order activity alongside failed rebounds and fresh lows would be consistent with persistent sell-side pressure, while a sustained reclaim of $1.90K–$1.98K would provide stronger evidence that supply is being absorbed.