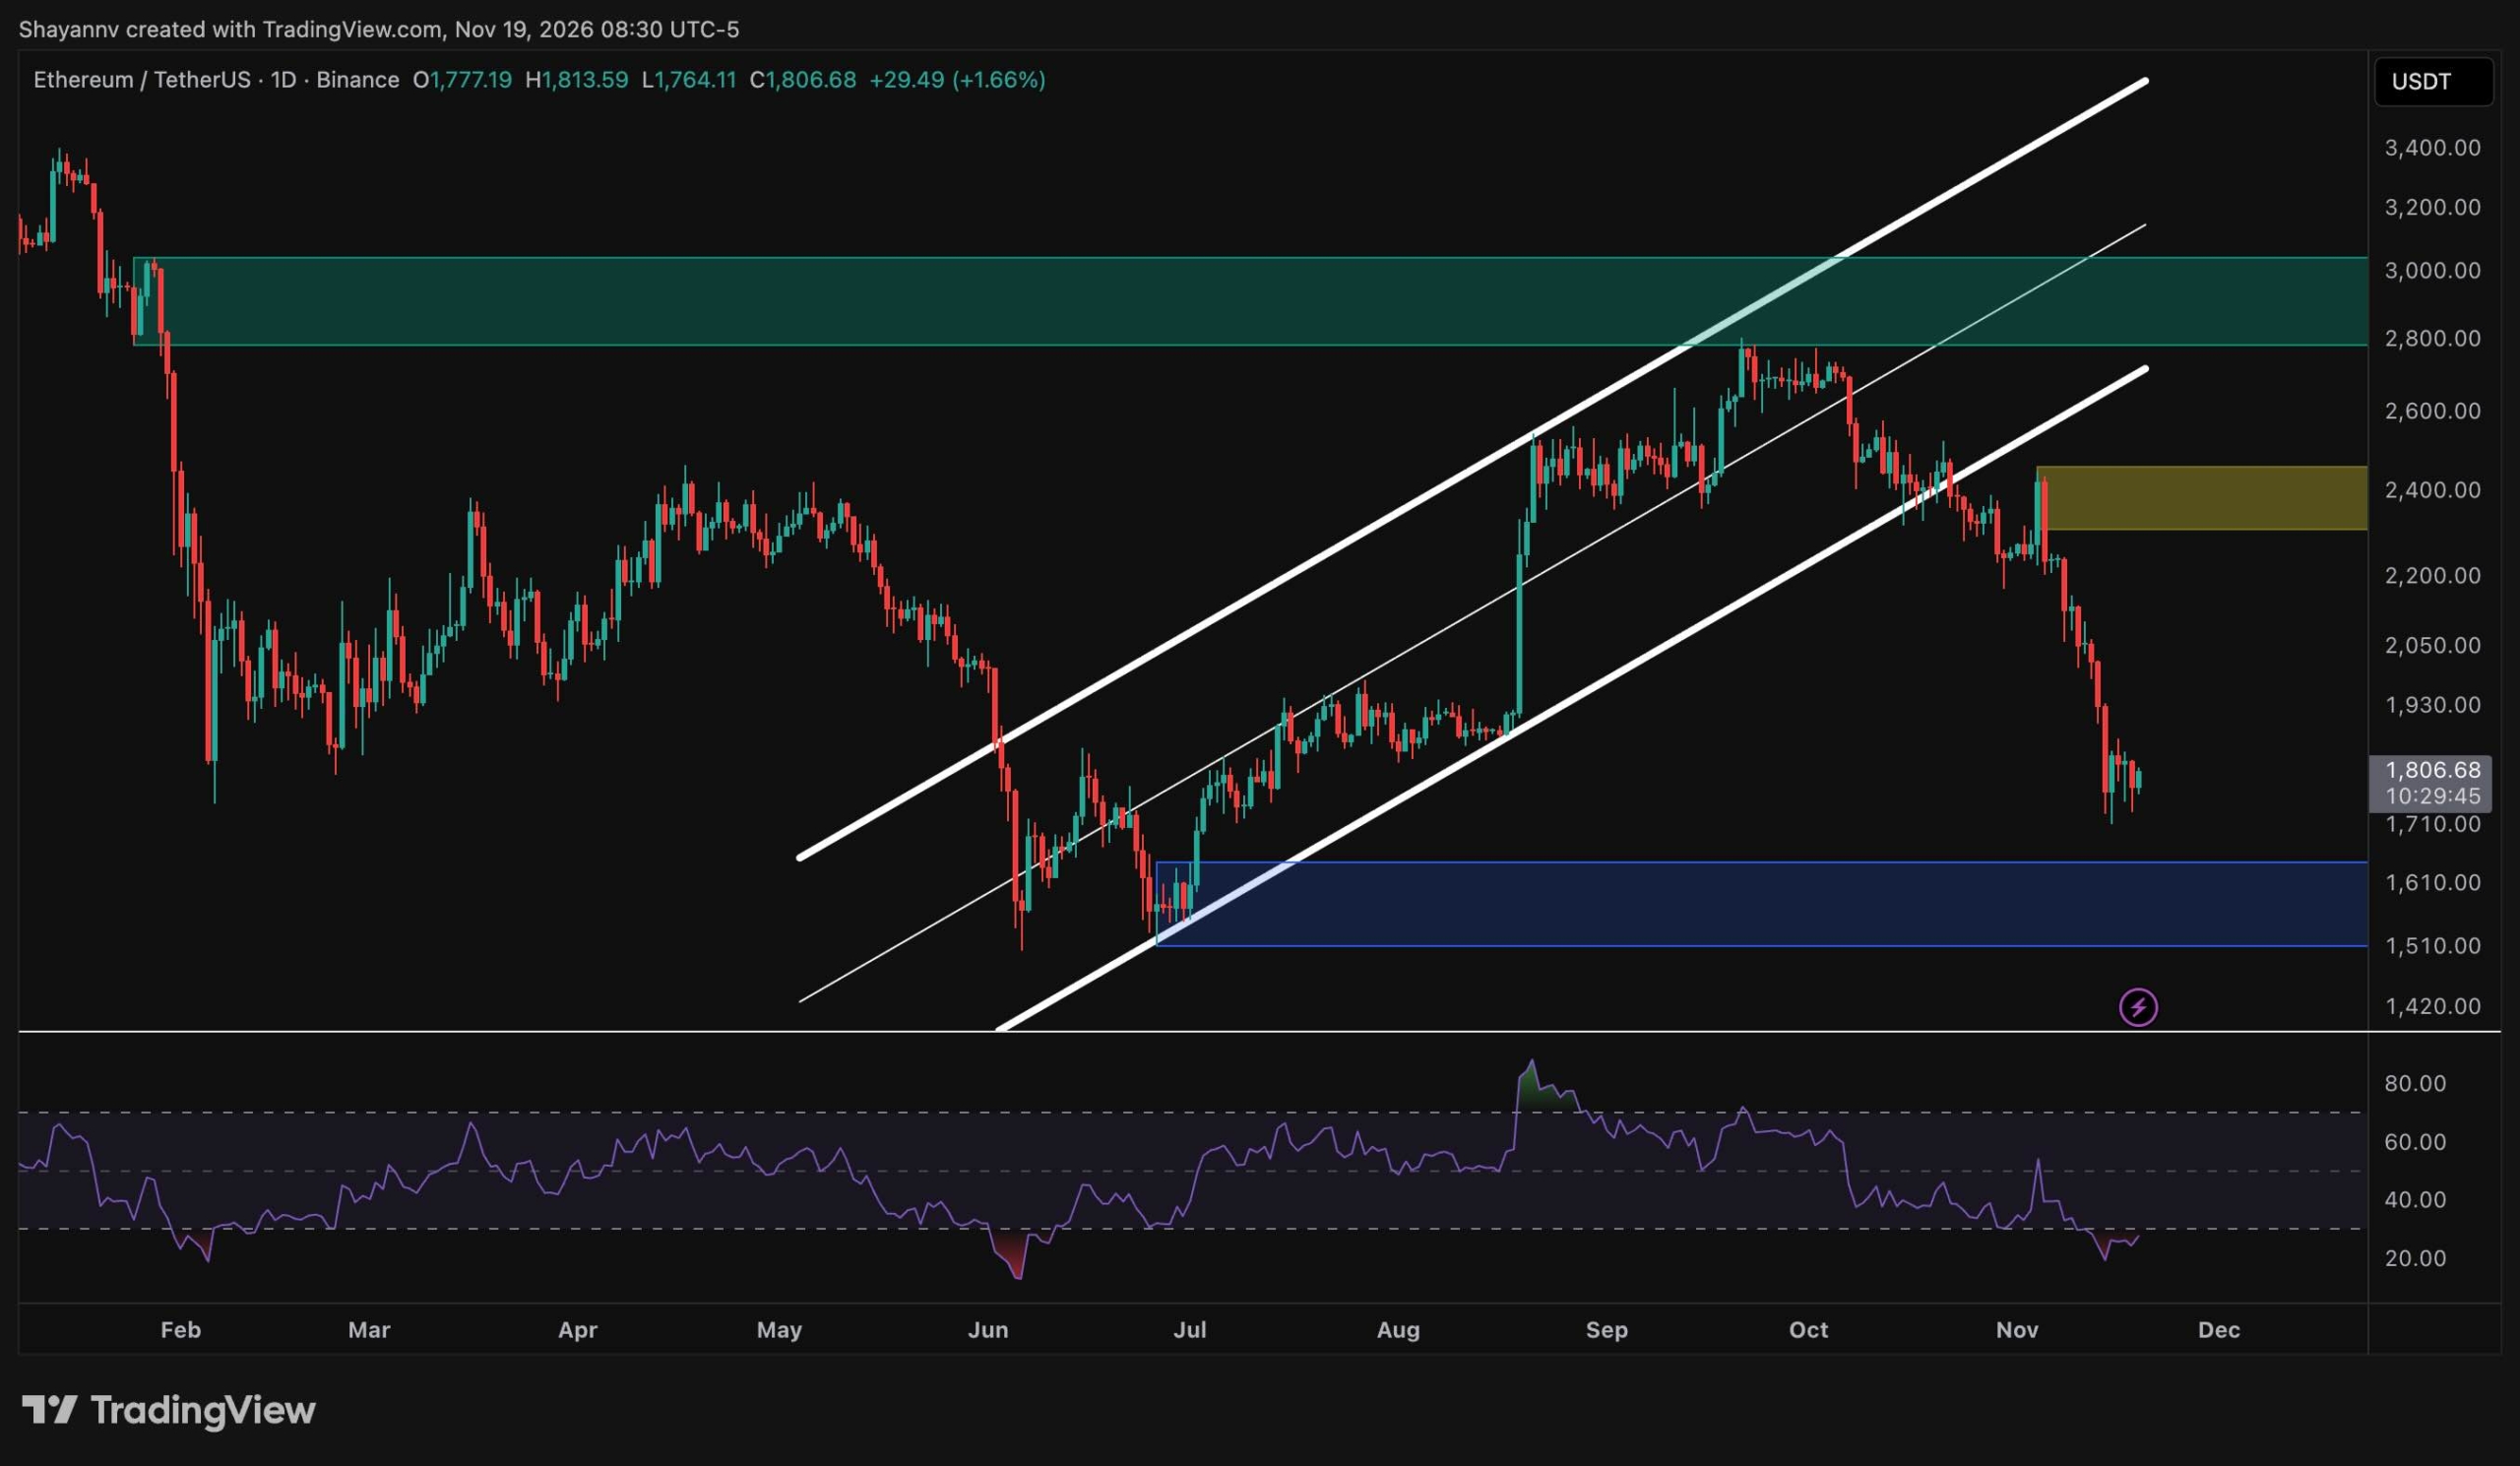
Ethereum is stabilizing around $1.8K after a steep November sell-off that erased the asset's entire August rally. With technical indicators showing mixed signals and network activity rising, analysts are monitoring key support and resistance levels to determine the direction of the next significant move.
Daily Chart Analysis
On the daily timeframe, ETH broke below an ascending channel that had guided its recovery from June lows in October. An early-November retest of the broken structure near $2.4K resulted in a sharp rejection, creating a strong bearish order block.
The subsequent sell-off drove prices through the psychological $2K level, reaching a low around $1.7K. ETH now trades near $1.8K, positioned above the $1.5K–$1.6K demand zone that formed the base of June–July accumulation.
For an improved outlook, buyers would need to reclaim $2K, with $2.4K representing a more decisive test. A decisive daily close below the recent low of $1.72K could expose the $1.5K–$1.6K demand zone.
The daily RSI has dropped to approximately 25, marking its first dip below the 30 threshold since June. At that earlier point, a similar oversold reading preceded a recovery. However, oversold conditions can persist during strong downtrends, and a move back above 30 would be needed to signal fading bearish momentum.
Four-Hour Chart Signals
The 4-hour chart shows a clear sequence of lower highs, with each breakdown leaving behind supply zones at $2.7K, $2.4K, $2.1K, and most recently $1.9K.
ETH has been ranging between roughly $1.7K and $1.85K in recent sessions, with the latest dip holding slightly above the prior low at $1.74K. A relief bounce from this base could reach the $1.9K supply zone, the first meaningful overhead barrier.
Breaking above $1.9K would ease immediate bearish pressure and bring $2.1K into view. Conversely, losing the $1.7K low would end consolidation and potentially push price toward $1.6K, the upper edge of the daily demand zone.
The 4-hour RSI has recovered from below 30 to approximately 45, suggesting short-term selling pressure is easing. However, the indicator remains below the neutral 50 level. A sustained move above 50 alongside a break above $1.85K would strengthen the stabilization attempt.
On-Chain Activity Rising
Ethereum's active addresses metric, which counts unique addresses sending or receiving ETH daily, has surged from roughly 375K to about 485K. However, this metric does not indicate whether activity stems from buying or selling.
During ETH's February 2026 decline from approximately $3.3K to $2K, active addresses reached their highest reading around 715K, suggesting elevated network activity can occur during price declines. The current spike in addresses could reflect capitulation-driven transfers rather than fresh demand.
If ETH holds $1.7K and reclaims $1.9K while activity remains elevated, the reading would be more constructive. Without price stabilization, the spike may simply signal heightened stress in the network.