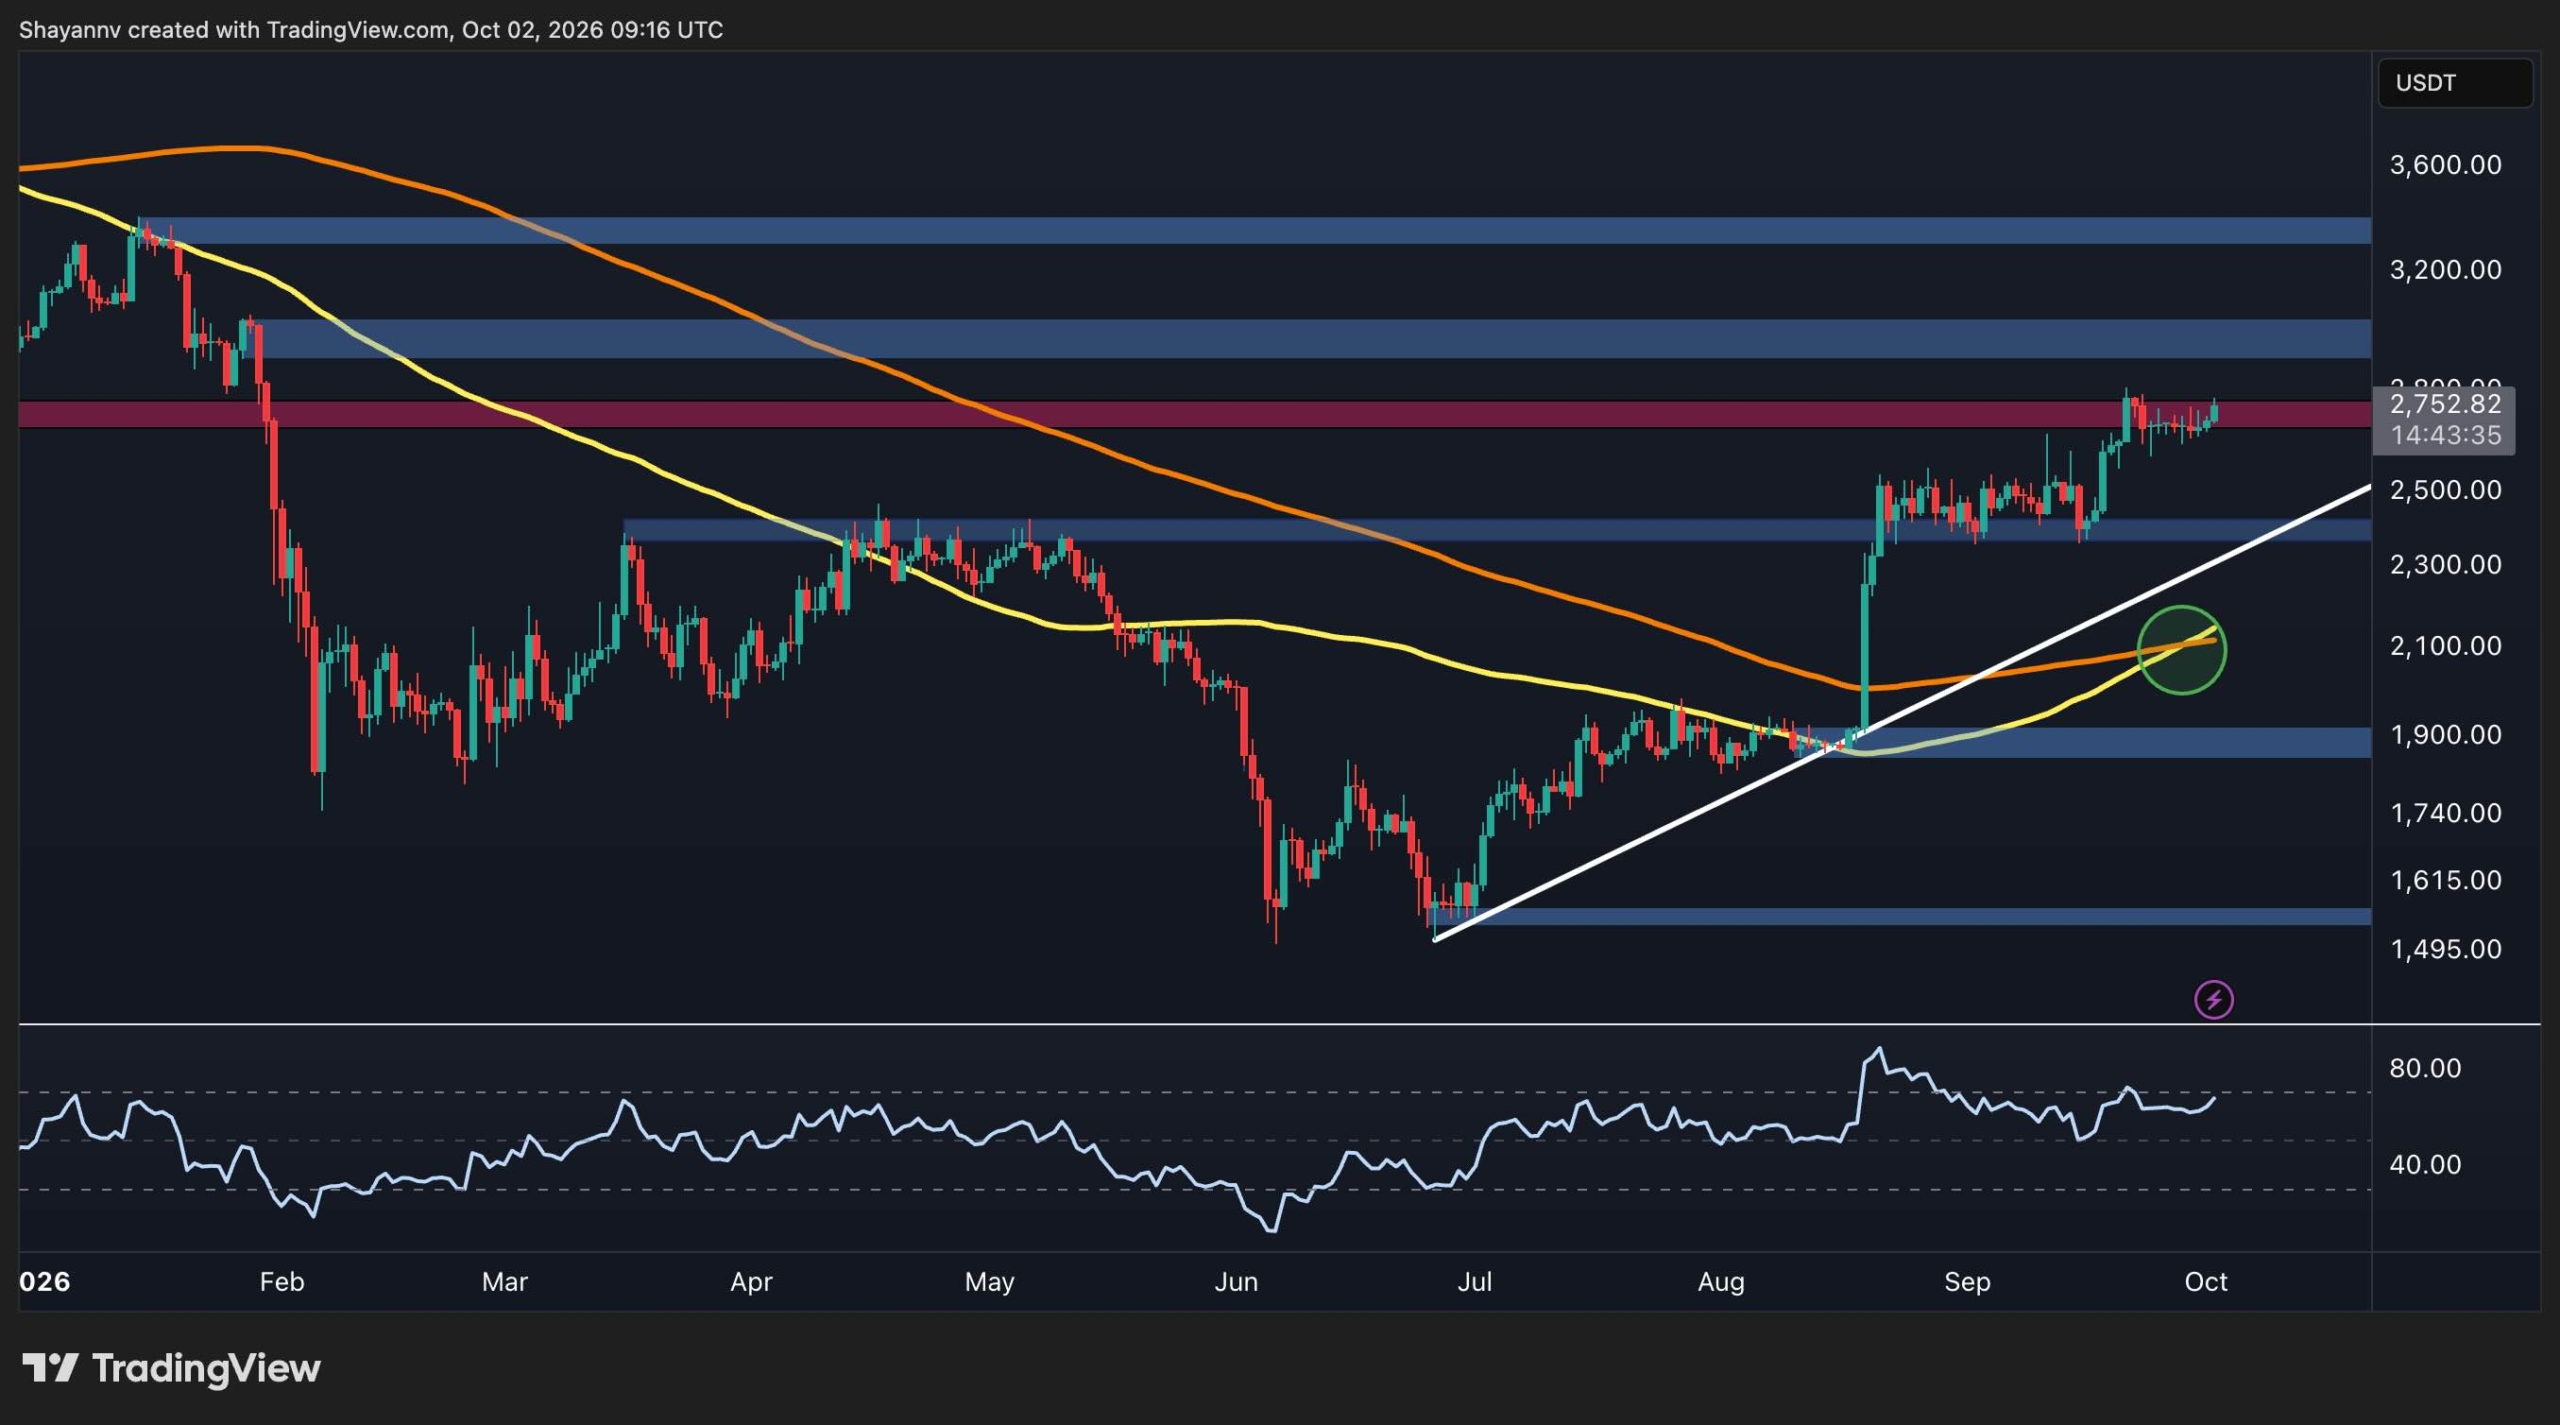
Ethereum is trading around $2.75K following a multi-week consolidation period above the $2.4K level. The asset is currently testing an important resistance area as market participants watch for a potential breakout toward the $3K region.
Daily Chart Structure
The daily chart reflects a structural improvement from the June low near $1.5K. Ethereum has established a sequence of higher lows along an ascending trendline and moved above both the 100-day and 200-day moving averages. A bullish crossover between these two moving averages occurred around the $2.1K level, with both indicators sloping upward.
After reclaiming the $2.4K region, ETH moved toward the $2.8K resistance zone. Current candles show tight consolidation rather than a decisive breakout. A daily close above this area could bring a bearish order block around $3K into focus, while a rejection could send the price back toward the $2.4K support zone and the ascending trendline.
4-Hour Chart and Momentum
On the 4-hour timeframe, ETH advanced from approximately $2.4K to $2.8K before moving sideways. The price has held above the $2.6K area while testing the upper boundary of the range near $2.8K. Support is identified around the $2.4K to $2.5K bullish order block, with deeper support levels located near $2.2K and the $1.85K to $1.9K region.
The 4-hour Relative Strength Index (RSI) stands in the low-60s, indicating that momentum favors the upside without registering extreme readings.
On-Chain Metrics
The Ethereum Coinbase Premium Index reads approximately -0.03 according to CryptoQuant data. The metric has largely stayed below zero, pointing to weaker buying pressure from US-based participants on Coinbase while ETH trades near the $2.8K resistance zone.
Historical patterns indicate that sustained bullish phases for Ethereum typically align with a positive Coinbase premium. A move back above zero alongside a break of the $2.8K resistance would signal strengthening spot demand, whereas a persistently negative premium during a struggle at resistance could prompt a pullback or further consolidation.