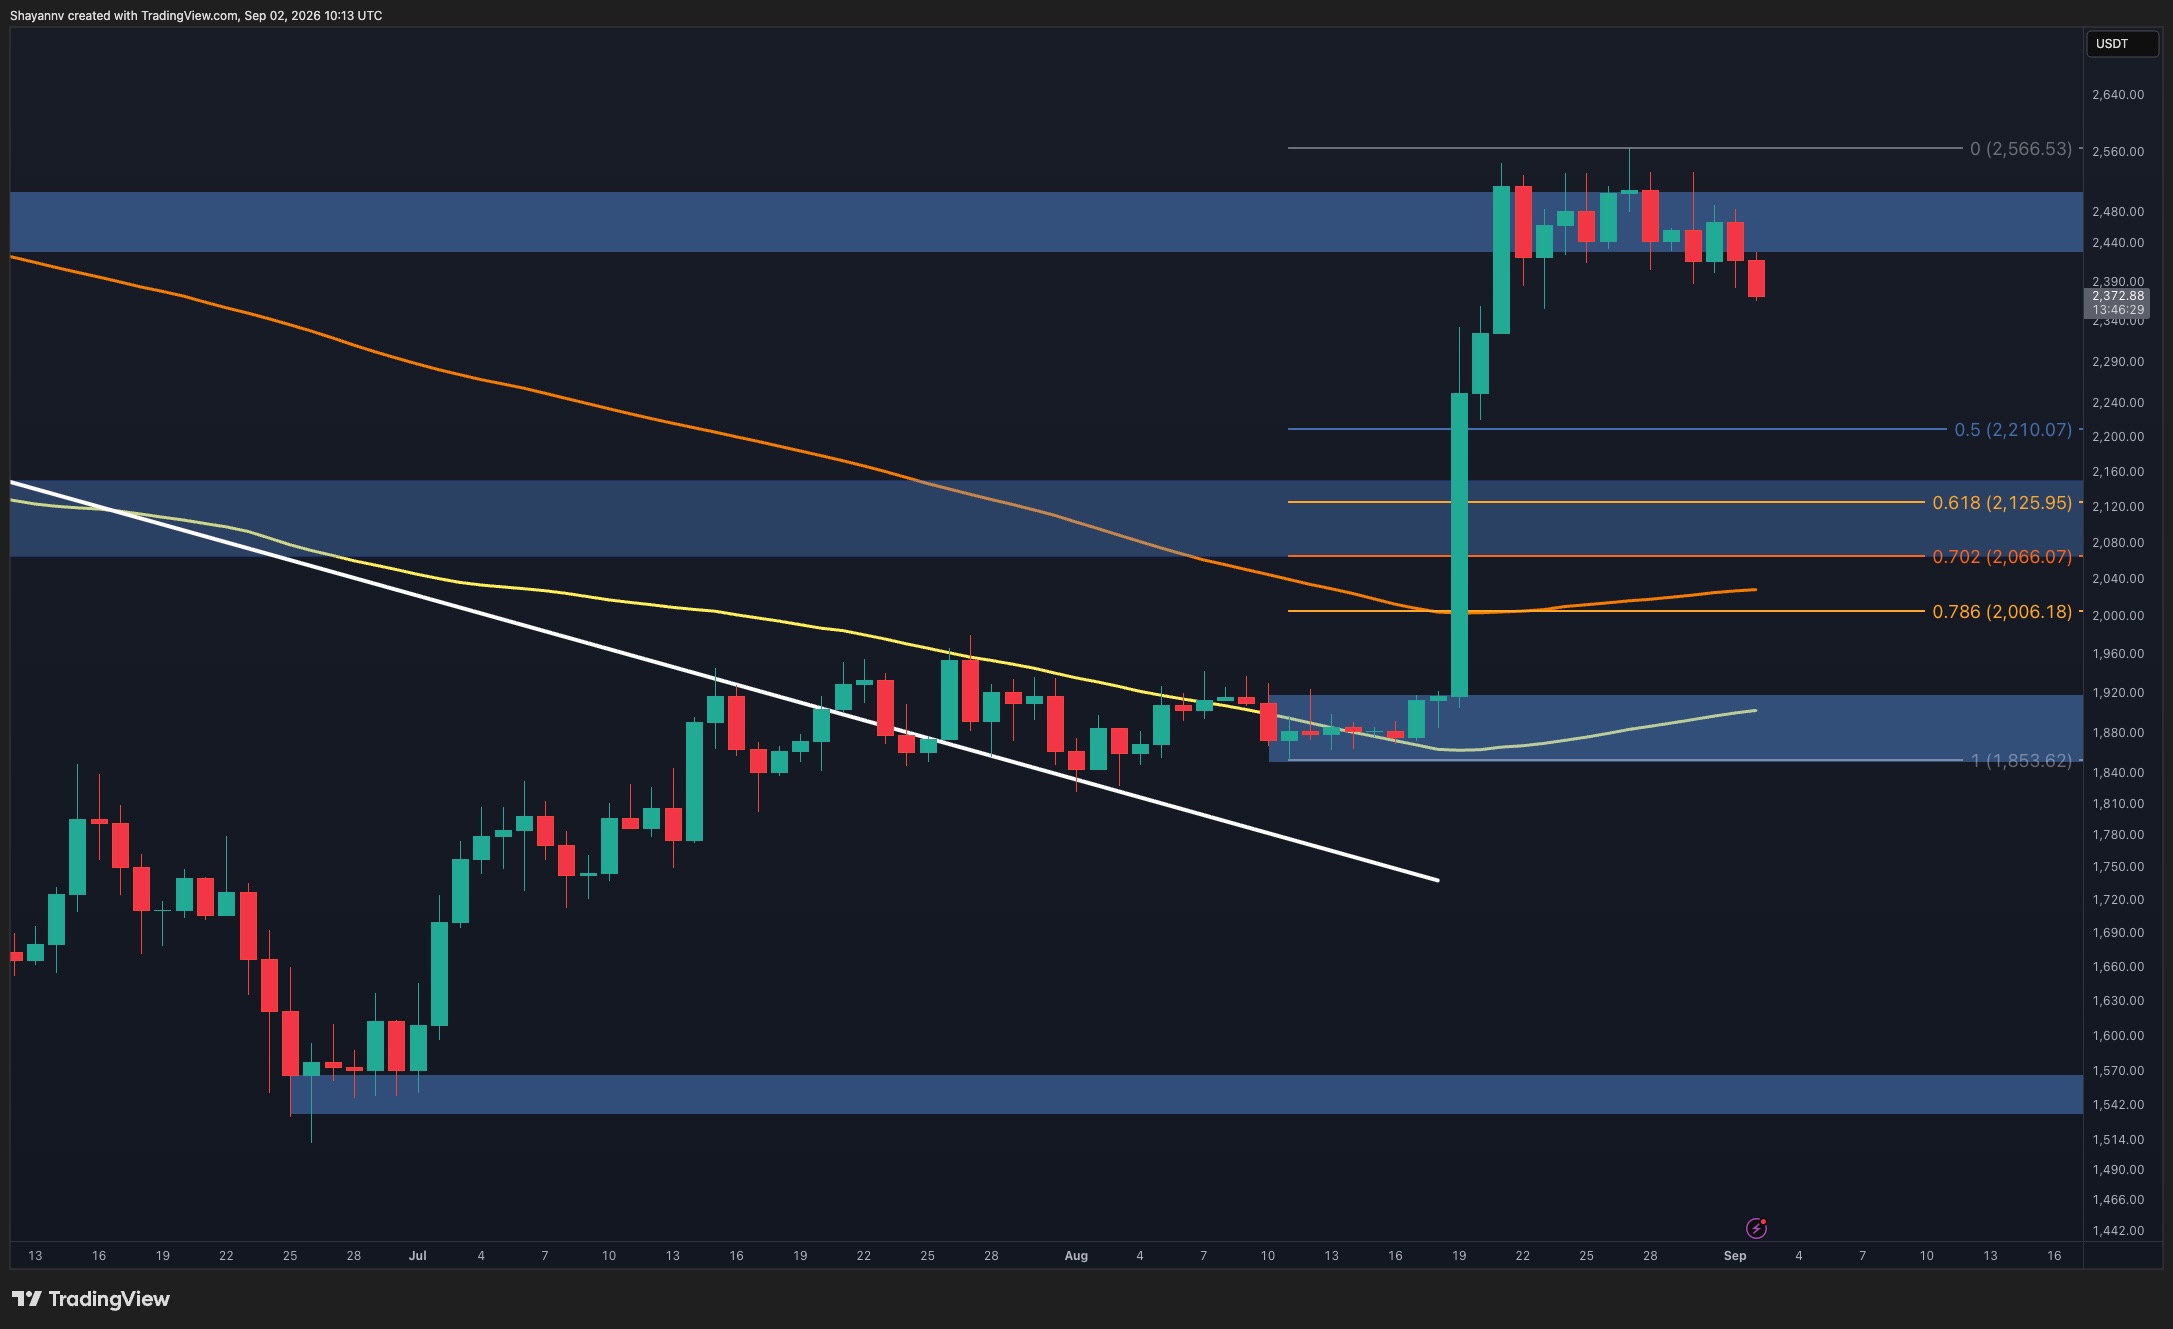
Ethereum's price action has shifted toward consolidation after its recent rally, with technical indicators suggesting potential downside pressure in the near term. The cryptocurrency is currently trading near $2.37K, having fallen below the $2.44K-$2.51K resistance zone that has proven difficult to break through sustainably.
Daily Chart Analysis
On the daily timeframe, Ethereum's initial bullish momentum from the $1.85K-$1.92K base has begun to wane. The asset reached the major $2.44K-$2.51K resistance area but has faced repeated rejection attempts, with the latest candles showing a gradual shift in favor of sellers.
If downward pressure continues, Fibonacci retracement levels provide potential support zones. The 0.5 retracement level sits around $2.21K, while the 0.618 level near $2.13K aligns closely with the broader $2.07K-$2.16K support zone. This confluence of technical levels may represent important demand areas if a deeper pullback develops.
A recovery back above $2.44K-$2.51K would reduce near-term bearish pressure and put the $2.57K local high back in focus as the next potential resistance target.
Short-Term Structure Deteriorating
The 4-hour chart displays a clearer deterioration in short-term market structure. After consolidating within the $2.43K-$2.51K range, Ethereum broke below this support level and is now approaching $2.37K. Recent rebounds have become progressively less effective at sustaining upside momentum, with the latest rejection from $2.48K-$2.50K followed by a sharp move lower.
The first major pullback zone on the 4-hour chart is positioned around $2.21K-$2.31K. Given the vertical nature of the original rally, relatively little price structure was established between the current level and this area, making a deeper retracement increasingly plausible if selling pressure persists. The next significant support sits around $2.07K-$2.12K.
Liquidation Levels Align with Technical Outlook
A two-week liquidation heatmap shows substantial concentration of liquidation liquidity immediately beneath the current price, roughly around $2.32K-$2.36K. This downside liquidity represents the most relevant near-term target and aligns with the weakening technical structure, suggesting that a sweep of this zone could occur as leveraged positions are cleared.