Ethereum has recovered significantly from its mid-year lows and pushed past the $2.5K threshold on Friday. While the price action shows constructive improvement in market structure, ETH remains below several higher-timeframe resistance levels.
A key on-chain metric tells a more cautious story: the Coinbase Premium Index is currently negative at around -0.07, suggesting that the recent recovery has not been accompanied by consistently strong spot demand from U.S.-based investors.
Daily Chart Analysis
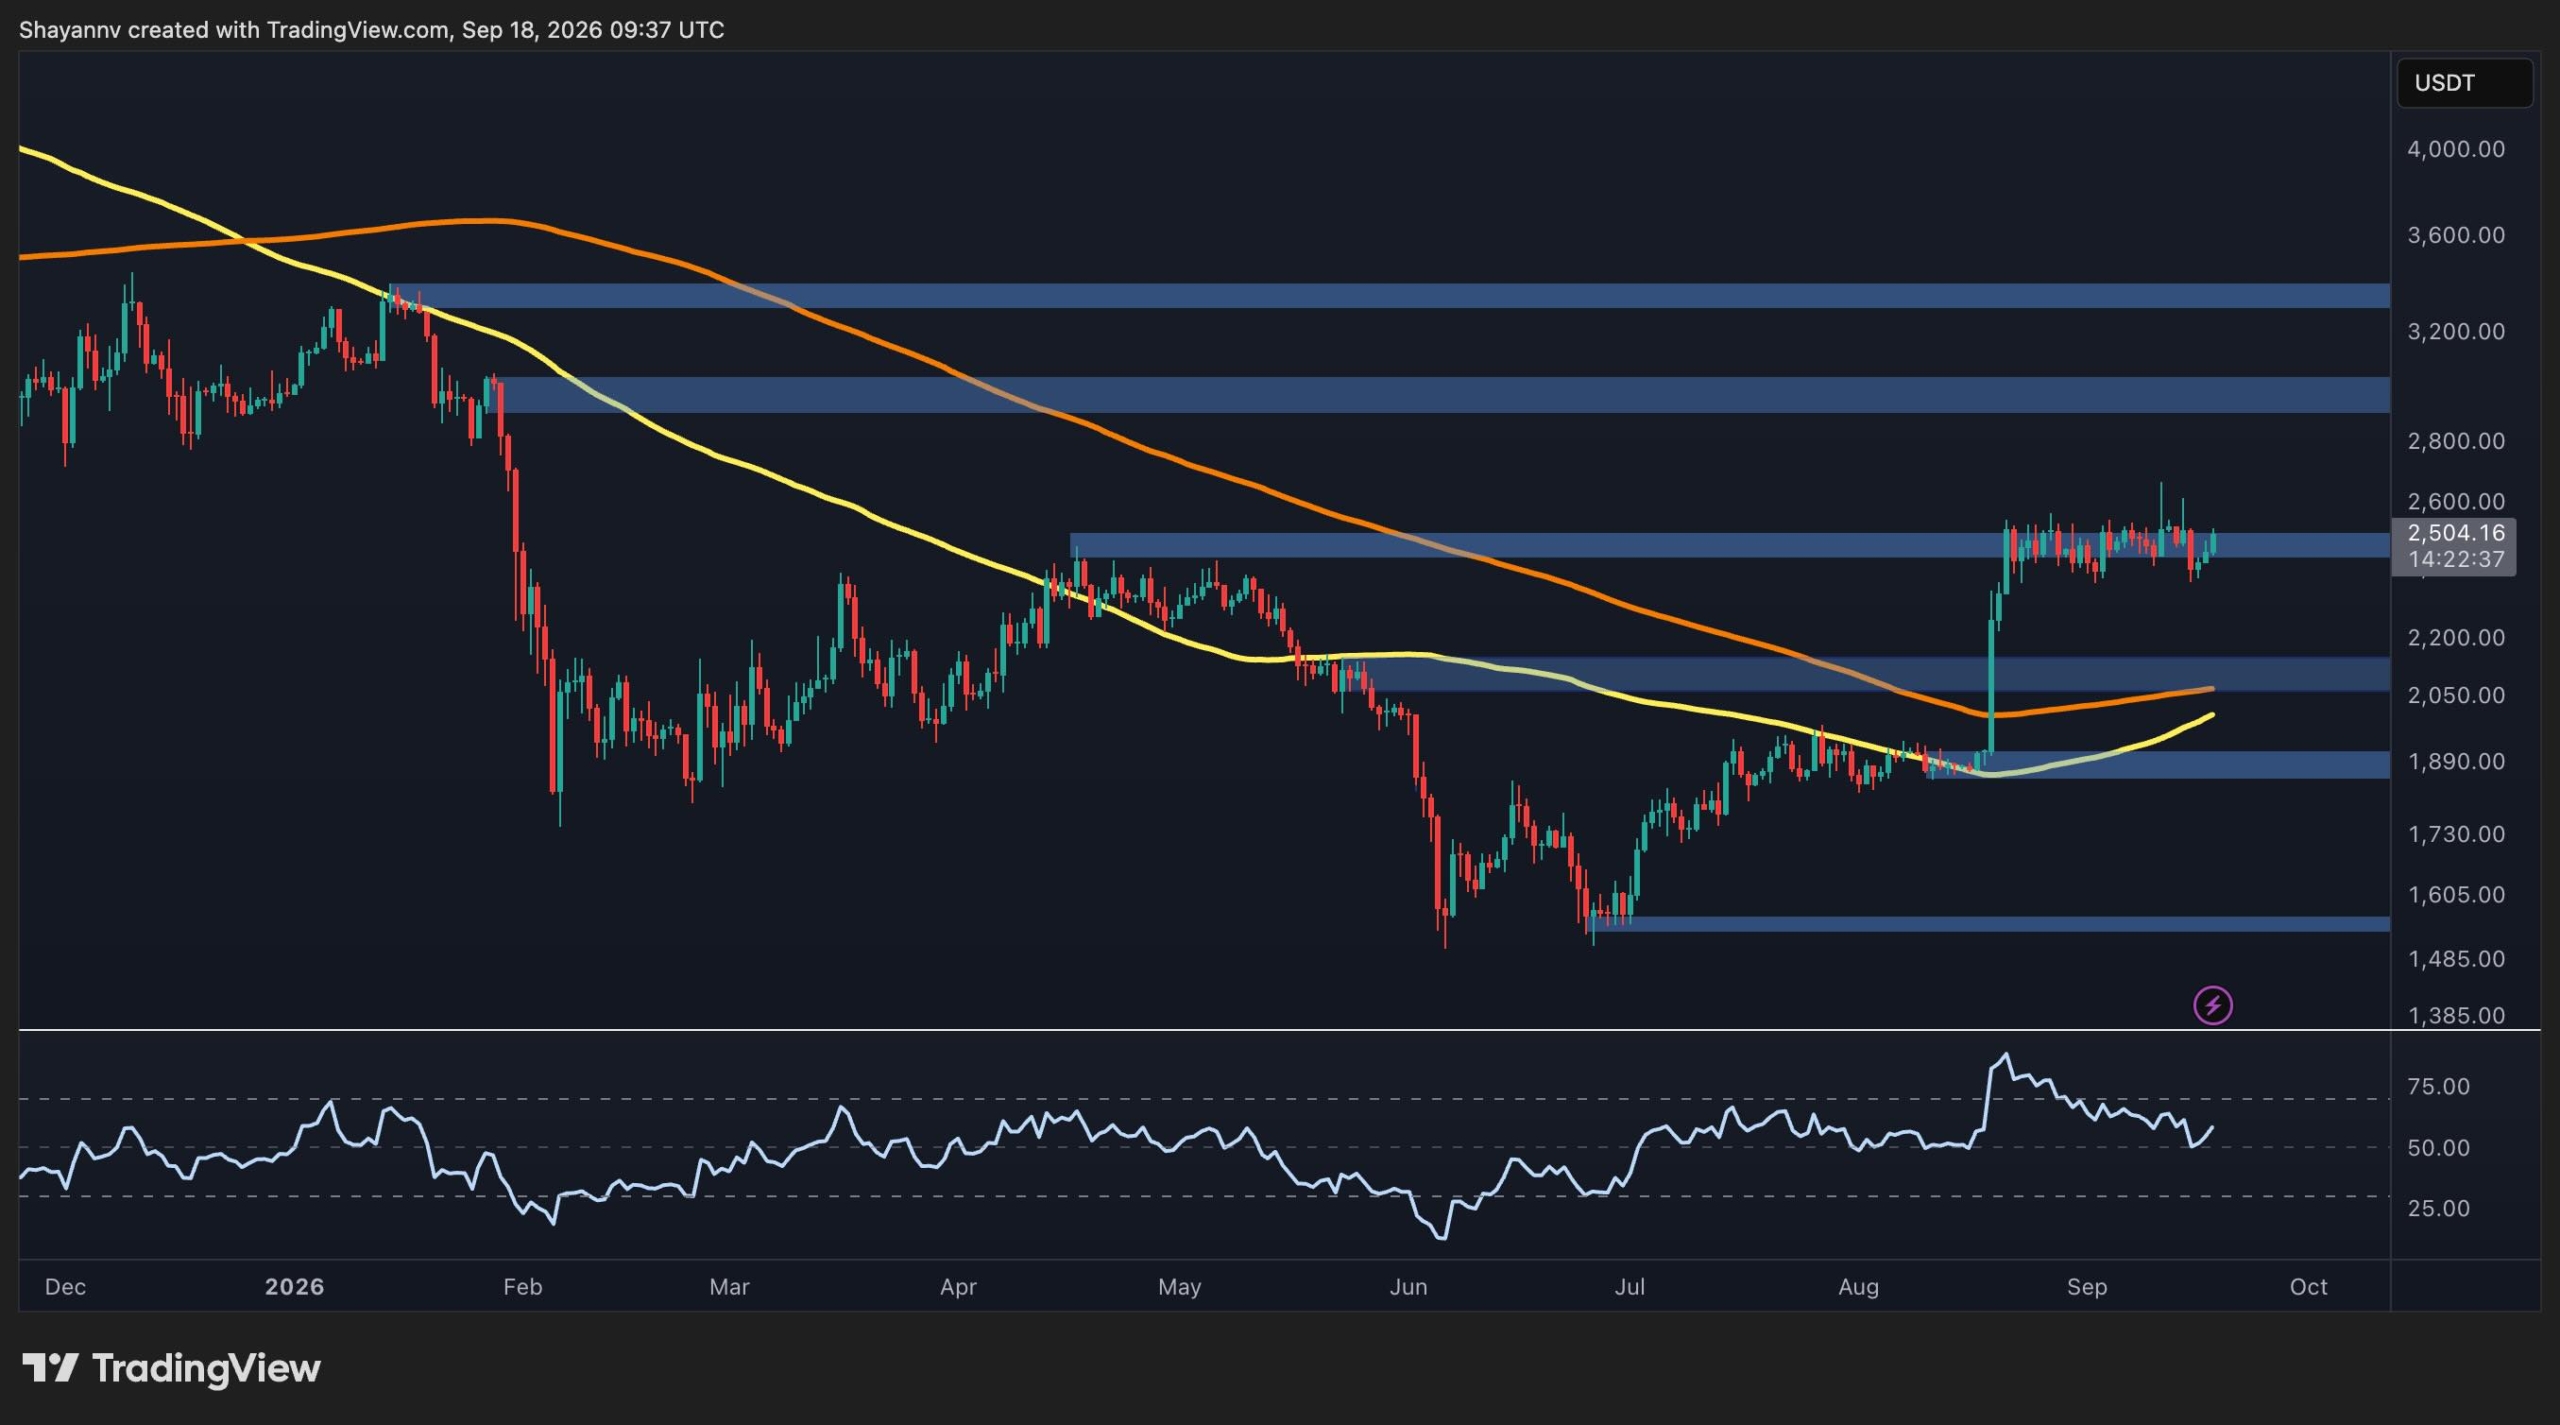
On the daily timeframe, ETH has recovered significantly from the $1.5K support level. The rebound has pushed price back above both the 100-day and 200-day moving averages, with the 100-day average approaching the 200-day average from below. A bullish crossover of these moving averages could occur around $2K.
ETH is currently trading in a key resistance zone at $2.5K that has repeatedly contained price during recent consolidation. A valid breakout above this level could open the path to the next major resistance around $3.0K, with an additional resistance zone at $3.3K-$3.4K coinciding with the broader structure established earlier in the year.
On the downside, the first important support sits around $2.1K, where the moving averages are clustered. Below that, the $1.9K zone represents the next notable support level. The daily RSI is in the mid-to-upper 50s, indicating bullish momentum without overbought conditions, leaving room for potential upside movement.
Four-Hour Consolidation
The 4-hour chart shows ETH consolidating within a broad range between approximately $2.35K and $2.65K since a sharp advance in late August. The current price action shows ETH recovering from the lower portion of this range and returning toward $2.5K.
Immediate resistance on the 4-hour chart is at $2.5K, followed by the upper range boundary near $2.65K. A decisive breakout above the latter would signal a clearer structural shift and could open pathways to higher daily resistance zones. Conversely, rejection around current resistance and a move below $2.35K would weaken the short-term structure.
On-Chain Signals
The Coinbase Premium Index has spent much of the recent period below zero, including the latest reading. This metric compares ETH prices on Coinbase with those on other major exchanges and is used as an indicator of relative buying pressure from Coinbase's predominantly U.S.-based market.
A notable divergence exists between price and the premium index. While ETH recovered from roughly $1.5K to around $2.5K, the Coinbase Premium remained generally negative throughout much of that advance, suggesting the recovery has not been driven by consistently strong U.S. spot demand. Brief positive spikes occurred during parts of the summer, but they did not develop into sustained positive trends.
A sustained move back above the zero line in the Coinbase Premium Index, particularly alongside a breakout above $2.5K, would provide confirmation that spot demand is strengthening and support the likelihood of continued recovery.