After a period of heightened buying activity and increased bullish momentum, Ethereum has successfully reclaimed a crucial resistance zone, notably the previous major yearly high at $3.6K.
This breakout, if confirmed by a retest, sets the stage for ETH to potentially establish a new all-time high in the near future.
By Shayan
The Weekly Chart
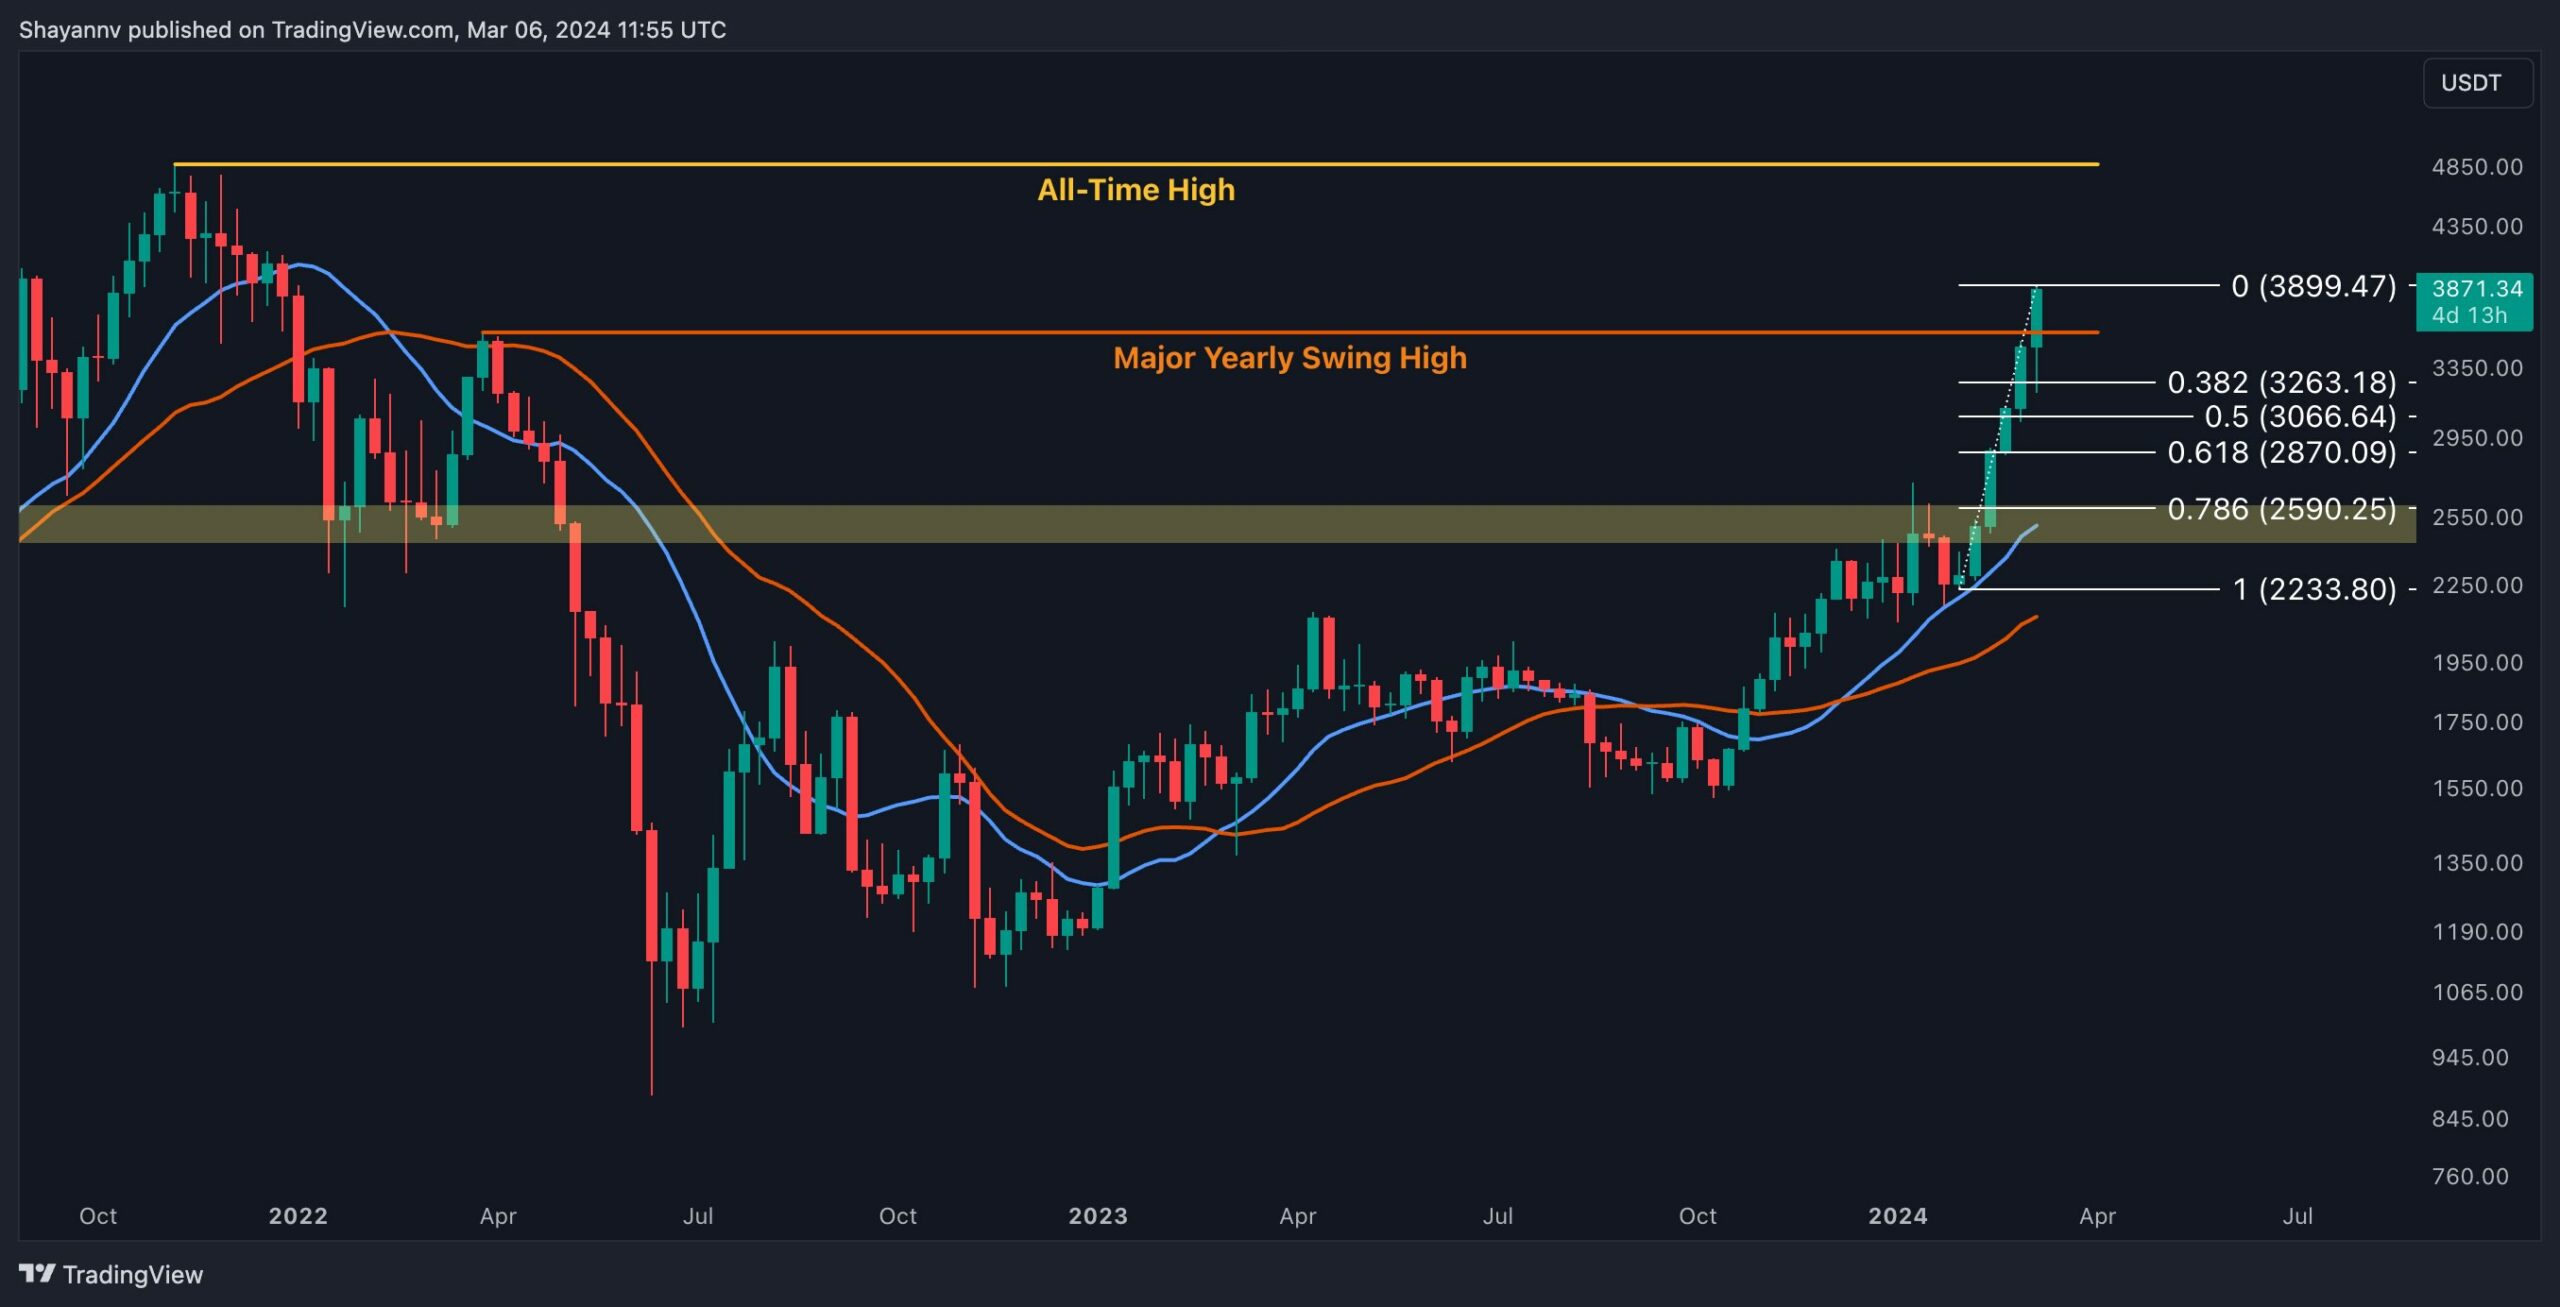
An in-depth analysis of the weekly chart reveals a significant bullish sentiment surrounding Ethereum, as evidenced by a substantial and impulsive upward movement surpassing the critical resistance represented by the prior major yearly high of $3.6K.
This price action reflects a strong interest from market participants in ETH, resulting in heightened demand.
In the event of a successful retest of the breached level, Ethereum’s price is expected to continue its upward trajectory, targeting the critical all-time high of $4868.
Despite the bullish outlook, Ethereum may encounter significant support around the $3.6K threshold, with additional support levels found within the 0.5 ($3066) and 0.618 ($2870) Fibonacci levels, serving as potential zones for corrective movements.
The 4-Hour Chart
Further analysis of the 4-hour chart confirms Ethereum’s overall bullish sentiment and increased market confidence, driving the price to its highest level since April 2022. This surge, accompanied by heightened market volatility, reflects substantial buying interest aimed at surpassing the notable resistance level of its ATH at $4.8K.
However, following a rejection at the significant $3.6K resistance, Ethereum found support within critical regions marked by the 0.5 and 0.618 Fibonacci levels, prompting an immediate reversal. However, the price surged past $3.6K, bolstered by prevailing market demand, indicating the buyers’ dominance in the market.
Currently, ETH approaches a significant psychological resistance zone near the $4K threshold. Given the strength of this price range and the rapid ascent of the current bullish rally, increased volatility and fluctuations are expected.
Despite potential short to mid-term corrections, the overall sentiment remains positive, with Ethereum poised for further upside potential.

By Shayan
Ethereum’s recent surge highlights an increase in investor confidence and heightened buying activity. An important indicator reflecting market dynamics is Ethereum’s funding rates, which measure the aggressiveness of trades in the futures market. Positive rates signal a bullish outlook, while negative rates indicate bearish sentiment among traders.
Notably, this metric has seen a significant uptick, reaching levels reminiscent of late 2020 when Ethereum was poised for a robust bullish rally toward its all-time high. This surge in funding rates indicates a strong bullish sentiment among futures traders, potentially leading to a sustained upward trend.
However, while rising funding rates typically accompany a bullish market sentiment, excessively high values can be dangerous.
Elevated rates increase the risk of long liquidation cascades, which may result in heightened market volatility and unexpected corrective movements. Therefore, traders should closely monitor funding rates amidst Ethereum’s bullish momentum and effectively manage risk to assess market conditions and anticipate potential price fluctuations.

Binance Free $100 (Exclusive): Use this link to register and receive $100 free and 10% off fees on Binance Futures first month (terms).
Disclaimer: Information found on CryptoPotato is those of writers quoted. It does not represent the opinions of CryptoPotato on whether to buy, sell, or hold any investments. You are advised to conduct your own research before making any investment decisions. Use provided information at your own risk. See Disclaimer for more information.
Cryptocurrency charts by TradingView.