 Price Could Make a 24% Recovery")
Bitcoin Cash (BCH) is marking a significant drawdown after crossing the $500 mark earlier this month. The single-day correction has crossed 10%.
However, this move from the investors suggests that a price crash may not be the only move for BCH. What else could happen?
Bitcoin Cash Price Has a Shot at Recovery
Bitcoin Cash’s price is below the $400 mark after falling by nearly 10% in a single day. Interestingly, this is the opposite of the expected outcome based on the indicators. Investors buying an asset is generally considered to be a positive sign, which BCH whales have been doing consistently.
Addresses holding between 100,000 to 1 million BCH, in particular, have been adding to their wallets. In the span of a week, their holdings have gone up from 2.77 million BCH to 2.88 million BCH.
Furthermore, the same outcome is expected from retail investors as well. The Market Value to Realized Value (MVRV) is a ratio that compares the current market cap of a cryptocurrency to its realized value, indicating whether it’s overvalued or undervalued based on the historical price movement of coins. In the case of BCH, the MVRV is at -10.56%.
Read More: Bitcoin Cash (BCH) Price Prediction 2024/2025/2030
This makes them more likely to accumulate more BCH and add it to their wallets, as it would also fall in line with the whale addresses. Since historically, an asset is more prone to accumulation around these MVRV ratios, this area is known as the “opportunity zone.”
BCH Price Prediction: Climb Back Likely?
Bitcoin Cash might find some trouble recovering, but the market conditions suggest that BCH is due for recovery. Since $344 is the next major support line coinciding with the 100-day Exponential Moving Average (EMA).
If the above conditions play into the price action, BCH could bounce off from $344 and make its way back to $501 by breaking $400, sitting in confluence with the 50-day EMA. This would stabilize corrections.
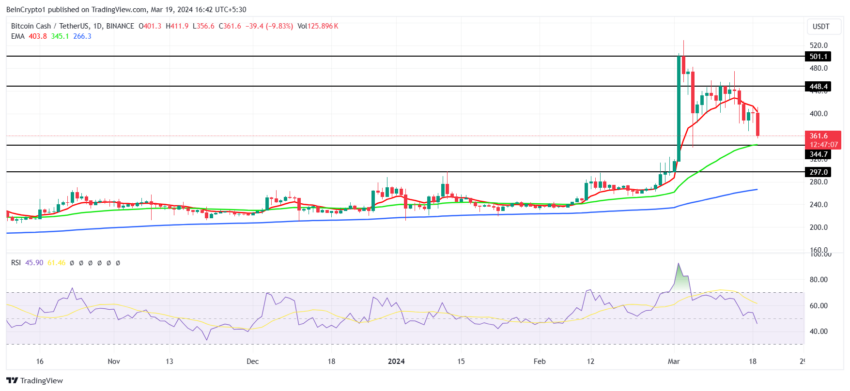
However, if the broader market cues weigh heavily and the 100-day EMA loses a support floor, a drawdown below $300 is on the cards. As is the Relative Strength Index (RSI) is already falling into the bearish zone.
RSI (Relative Strength Index) measures the speed and change of price movements to assess whether a stock or asset is overbought or oversold. Falling into the bearish zone is suggestive of a potential drawdown going ahead.
Read More: How To Buy Bitcoin Cash (BCH) and Everything You Need To Know
If this were to happen, the $297 support would be tested, and the bullish thesis would be invalidated.
The post Here’s How Bitcoin Cash (BCH) Price Could Make a 24% Recovery appeared first on BeInCrypto.