 Price Decrease Slowing Down? Here’s What to Look out For")
The Polygon (MATIC) price has decreased under a long-term descending resistance trend line and fell below a horizontal area last week.
Can MATIC regain momentum and break out from this resistance, or are there further lows in store? Let’s find out!
Polygon Fails to Break Out
The weekly time frame technical analysis shows that MATIC has fallen under a descending resistance trend line since its all-time high in 2022. So far, the trend line has been in place for nearly 730 days. MATIC validated it numerous times, most recently last week.
However, the MATIC price was rejected and has fallen since. Despite the decrease, MATIC still trades above an important horizontal area.
With the RSI as a momentum indicator, traders can determine whether a market is overbought or oversold and decide whether to accumulate or sell an asset.
Read More: How To Buy Polygon (MATIC) and Everything You Need To Know
Bulls have an advantage if the RSI reading is above 50 and the trend is upward. The opposite is true if the reading is below 50. The RSI gives a mixed reading since it is slightly above 50 but decreasing.
What Are Analysts Saying?
Cryptocurrency traders and analysts on X are undetermined about the future MATIC price trend.
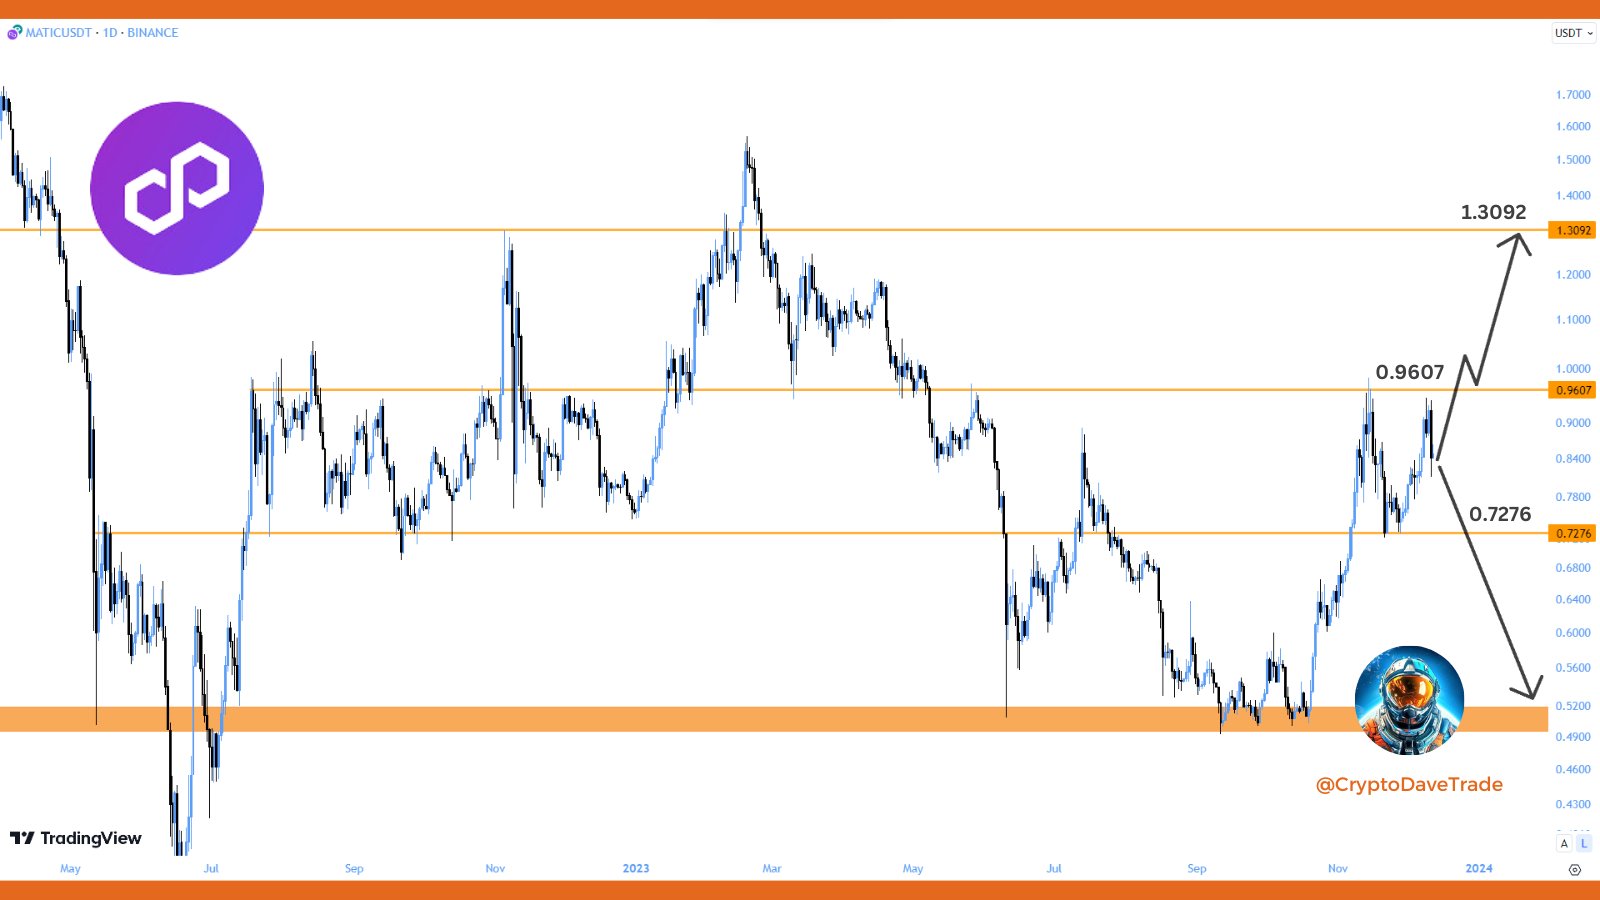
Crypto Dave suggests the price will likely get to $1, but he will turn bearish if a decrease below $0.72 occurs. He tweeted:
1. Price predictions as follows 2. I’m looking for MATIC to break $.96 level and get to $1 before the year ends. 3. Remains bullish as long as we’re above $.72 level.
Dark Green is decisively bearish. He believes the MATIC upward movement has ended, and the altcoin will begin a long correction, falling outside of the top 20 coins ranked by market capitalization.
Predict the price: Polygon (MATIC) Price Prediction 2024/2025/2030
MATIC Price Prediction: When Will Correction End?
Technical analysts utilize the Elliott Wave theory to recognize recurring long-term price patterns and investor psychology, aiding them in determining the trend’s direction.
According to the most likely count, the MATIC price has concluded a five-wave upward movement that began in September. Currently, it is in the C wave of an A-B-C corrective structure. Additionally, a bearish divergence in the daily RSI further supports the decreased expectation.
If the MATIC price continues to decrease, the probable target for the bottom of the C wave is identified at the 0.618 Fibonacci retracement support level, situated at $0.68. This projection establishes a 1:1 ratio between waves A and C, translating to a 13% drop.
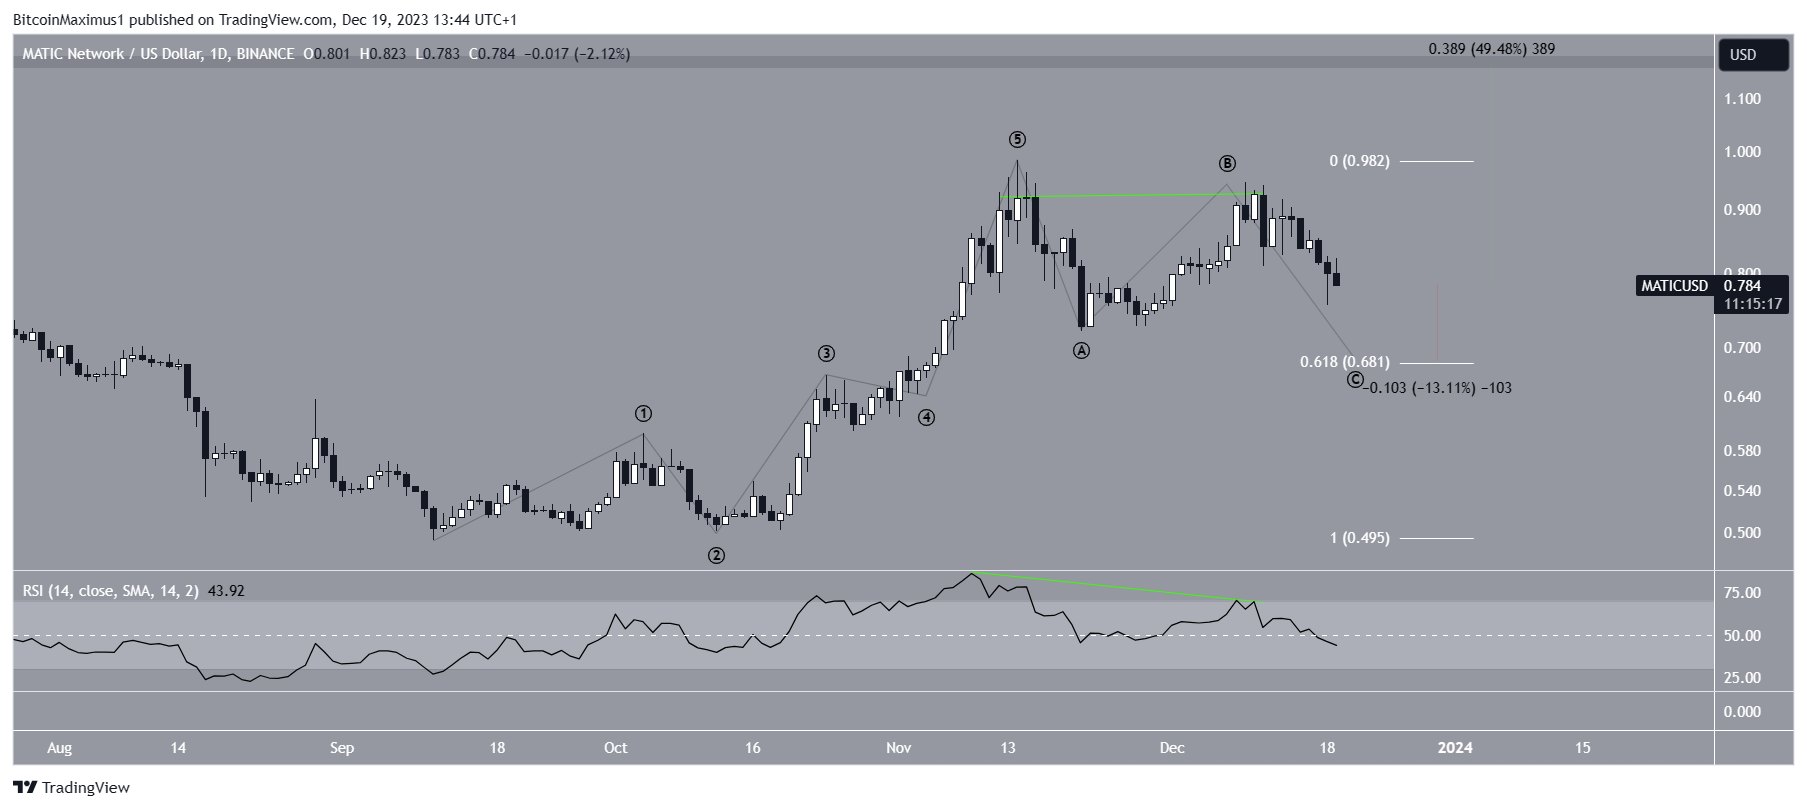
Despite this negative MATIC price forecast, breaching the wave B high at $0.95 could trigger a substantial 50% increase, leading to the next resistance level at $1.15.
For BeInCrypto’s latest crypto market analysis, click here.
Best crypto platforms in Europe | December 2023
![]()
KuCoin
KuCoin” target=”_blank”>Explore →
![]()
Wirex App
Wirex App” target=”_blank”>Explore →
![]()
YouHodler
YouHodler” target=”_blank”>Explore →
![]()
Margex
Margex” target=”_blank”>Explore →
Explore more
The post Is the Polygon (MATIC) Price Decrease Slowing Down? Here’s What to Look out For appeared first on BeInCrypto.