 Price Consolidating Before Pushing to New Highs?")
Solana (SOL) saw its user base peak on March 17, with numbers dwindling since then. Despite this, the SOL price remains in focus as trading activity stays high, indicating persistent interest. This suggests that while the user count has fallen, engagement remains strong.
Technical indicators like the Relative Strength Index (RSI) show health, but there’s a cautionary note as EMA lines hint at a possible bearish trend. This mix of high trading activity and uncertain technical signals raises the question of whether SOL is preparing for consolidation before achieving new highs.
SOL RSI Indicator Remains Healthy
The Relative Strength Index (RSI) for Solana currently sits at 48. This reflects a restrained selling atmosphere, not enough to classify the asset as undervalued or push it into overbought status. This balance hints that Solana could be entering a consolidation phase for its price.
The RSI measures the speed and change of price movements on a scale of zero to 100. Typically, a value over 70 indicates a potentially overbought condition and a value below 30 suggests an asset may be oversold.
This equilibrium in RSI levels presents possible outcomes for Solana. One scenario might be market stabilization, where the price remains steady, indicating the market is in a wait-and-see mode. Both traders and investors could be looking for clear indicators that point to where SOL price will head next.
Read More: Solana (SOL) Price Prediction 2024/2025/2030
Solana Total Value Locked Breaks $4 Billion – First Time in 2 Years
The Total Value Locked (TVL) within the Solana ecosystem has recently achieved a significant milestone, surpassing $4 billion for the first time since April 2022.
This metric, which represents the cumulative value of assets held across decentralized finance (DeFi) platforms on Solana, is essential for assessing the ecosystem’s overall vitality, the utility of its applications, and the level of active user participation. The rise in TVL is a strong indicator of renewed investor confidence and growing interest in Solana DeFi offerings.
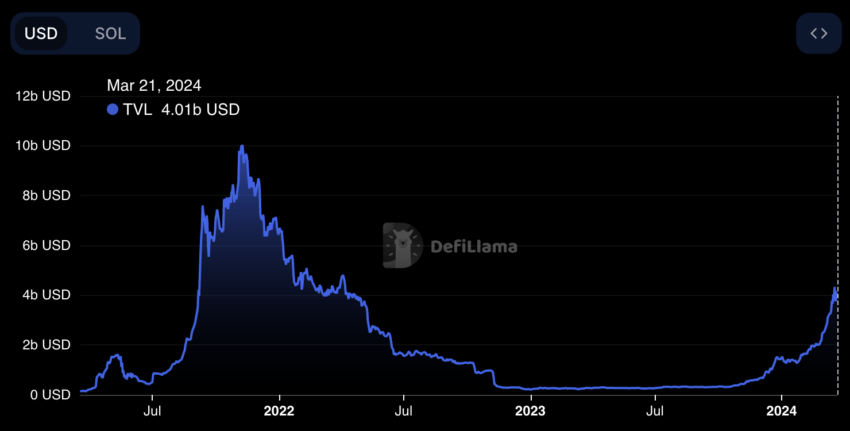
Back in 2021, Solana’s TVL saw an impressive peak, reaching upwards of $10 billion. However, following this period of rapid growth, there was a notable downturn, with the TVL significantly retracting. Between November 2022 and November 2023, the TVL figures hovered between $250 million and $350 million, suggesting a phase of stabilization and consolidation within the ecosystem. This period of relative stability laid the groundwork for the recent surge, marking a promising uptick in Solana’s DeFi activity.
Solana Reached 2 Million Users Recently
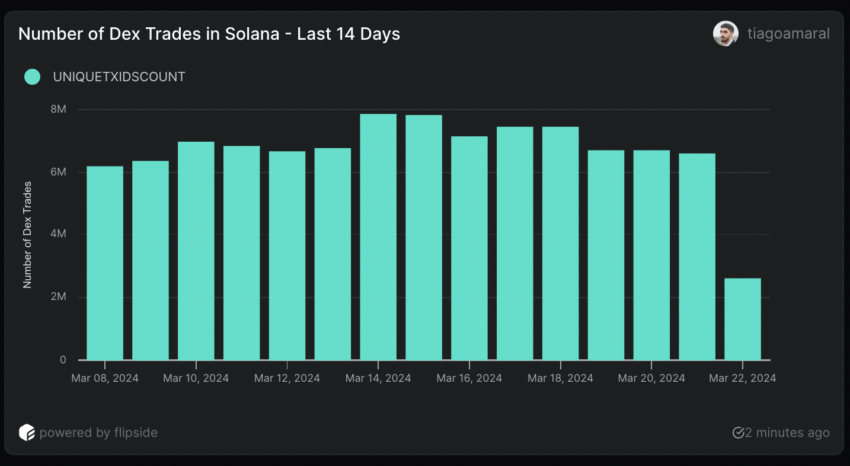
Analyzing two Solana on-chain metrics reveals some interesting scenarios. The record-breaking daily volume of DEX transactions, which hit 7.86 million on March 14, marks an all-time high. Since March 8, the trading volume on Solana DEXs has been consistently above 6 million transactions per day. This is a significant increase from the pre-December 2023 era when the peak daily transaction volume on Solana DEXs capped at 2.2 million.
Although the number of DEX trades is way above its historical average, the growth rate is losing its pace, and the number of daily DEX trades has been decreasing since March 15. Between that day and March 18, the SOL price grew from $176 to $208 and then entered into a correction afterward.
Another noteworthy metric from Solana’s on-chain data is the Daily Unique Transaction Signers, which essentially tracks the daily count of distinct users executing transactions on the network.
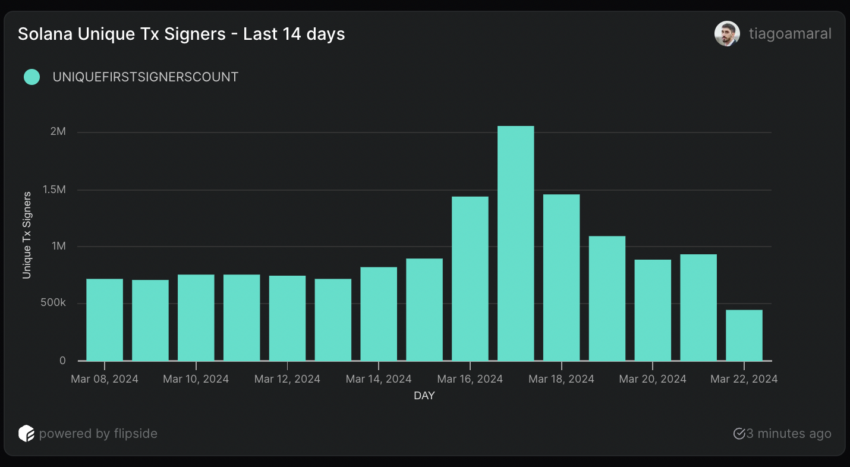
Since January 2024, this figure has shown a steady increase. By March 8, the metric hit 717,000 users, and by March 17, it surged to more than 2,000,000, marking a 178.94% increase in less than ten days. However, after Solana hit more than 2,000,000 unique users in a single day, its number of daily signers started to fall, reaching 936,000 on March 21.
Although this number is still way above the daily users Solana was registering just some weeks ago; this decline could indicate a consolidation before the network starts growing again.
SOL Price Prediction: EMA Lines Could Draw A Consolidation Phase Soon
When analyzing the SOL 4-hour price chart, we clearly see that the 20 EMA line is almost crossing below the 50 EMA line. Exponential Moving Averages (EMAs) are technical indicators used in financial markets to smooth out price data over a specified period, giving more weight to recent prices to make them more responsive to new information.
Unlike simple moving averages (SMAs), EMAs react more quickly to price changes, making them valuable for identifying trend directions and potential reversals.
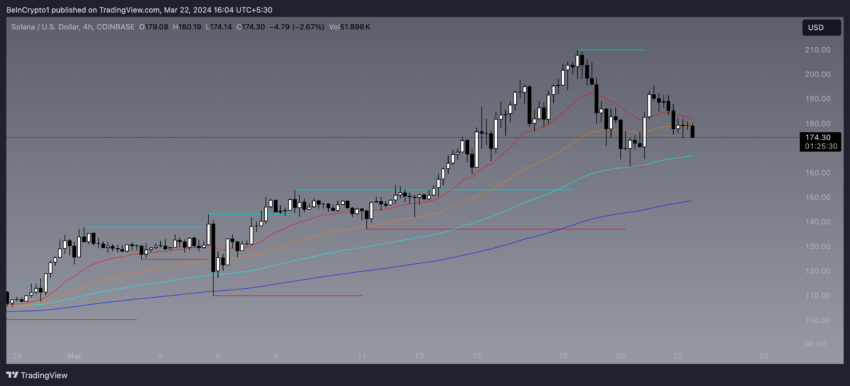
When a shorter-term EMA, like the 20 EMA, crosses below a longer-term EMA, such as the 50 EMA, it can signal a shift in momentum towards a bearish outlook, suggesting that short-term prices are declining relative to the longer term. This scenario is often interpreted as consolidation, indicating a period where prices stabilize after a move as buyers and sellers reach equilibrium.
Read More: 6 Best Platforms To Buy Solana (SOL) in 2024
As we can see from the SOL price chart, short-term EMAs are significantly above longer-term EMAs, such as the 100 and 200, but align with the current price level. In that case, it suggests consolidation for SOL price in the short term.
If Solana enters a correction phase, the price could test the $161 support. If that one isn’t enough, $137 could be the next target. That would represent a 21% correction. However, if SOL price bull run continues, it could revert to the consolidation phase and get back to $210 soon, a 20% increase from the current price.
The post Is the Solana (SOL) Price Consolidating Before Pushing to New Highs? appeared first on BeInCrypto.