
The Shiba Inu (SHIB) price has traded inside a long-term descending parallel channel for over a year.
Earlier today, Justin Sun withdrew $6 million in SHIB from Binance. How will this affect the price?
Shiba Inu Fails to Break Out
The technical analysis from the daily time frame shows that the SHIB price has traded inside an ascending parallel channel since June. Both the channel’s resistance and support trend lines have been validated numerous times during this time.
More recently, SHIB bounced at the support trend line on October 19 (green icon) and accelerated its rate of increase. The increase led to a high of $0.0000119, validating the channel’s resistance trend line (red icon) and breaking out from a horizontal resistance area.
However, the upward movement could not be sustained, and the SHIB price fell the same day, decreasing below the resistance area.
Market traders use the RSI as a momentum indicator to identify overbought or oversold conditions and to decide whether to accumulate or sell an asset.
Readings above 50 and an upward trend indicate that bulls still have an advantage, whereas readings below 50 suggest the opposite.
Read More: Shiba Inu (SHIB) Price Prediction 2024/2025/2030
The RSI is above 50 but decreasing, a sign of a mixed trend. However, the RSI also shows that the decrease was preceded by bearish divergence (green), a sign often associated with bearish trend reversals.
What Do Analysts Say?
Cryptocurrency analyst and Global Head of News at BeInCrypto Ali Martinez said that the SHIB price could be in the process of breaking out. He tweeted:
#ShibaInu is showing signs of breakout! If $SHIB maintains the crucial support level at $0.0000103, the next stop for #SHIB could be $0.0000140.
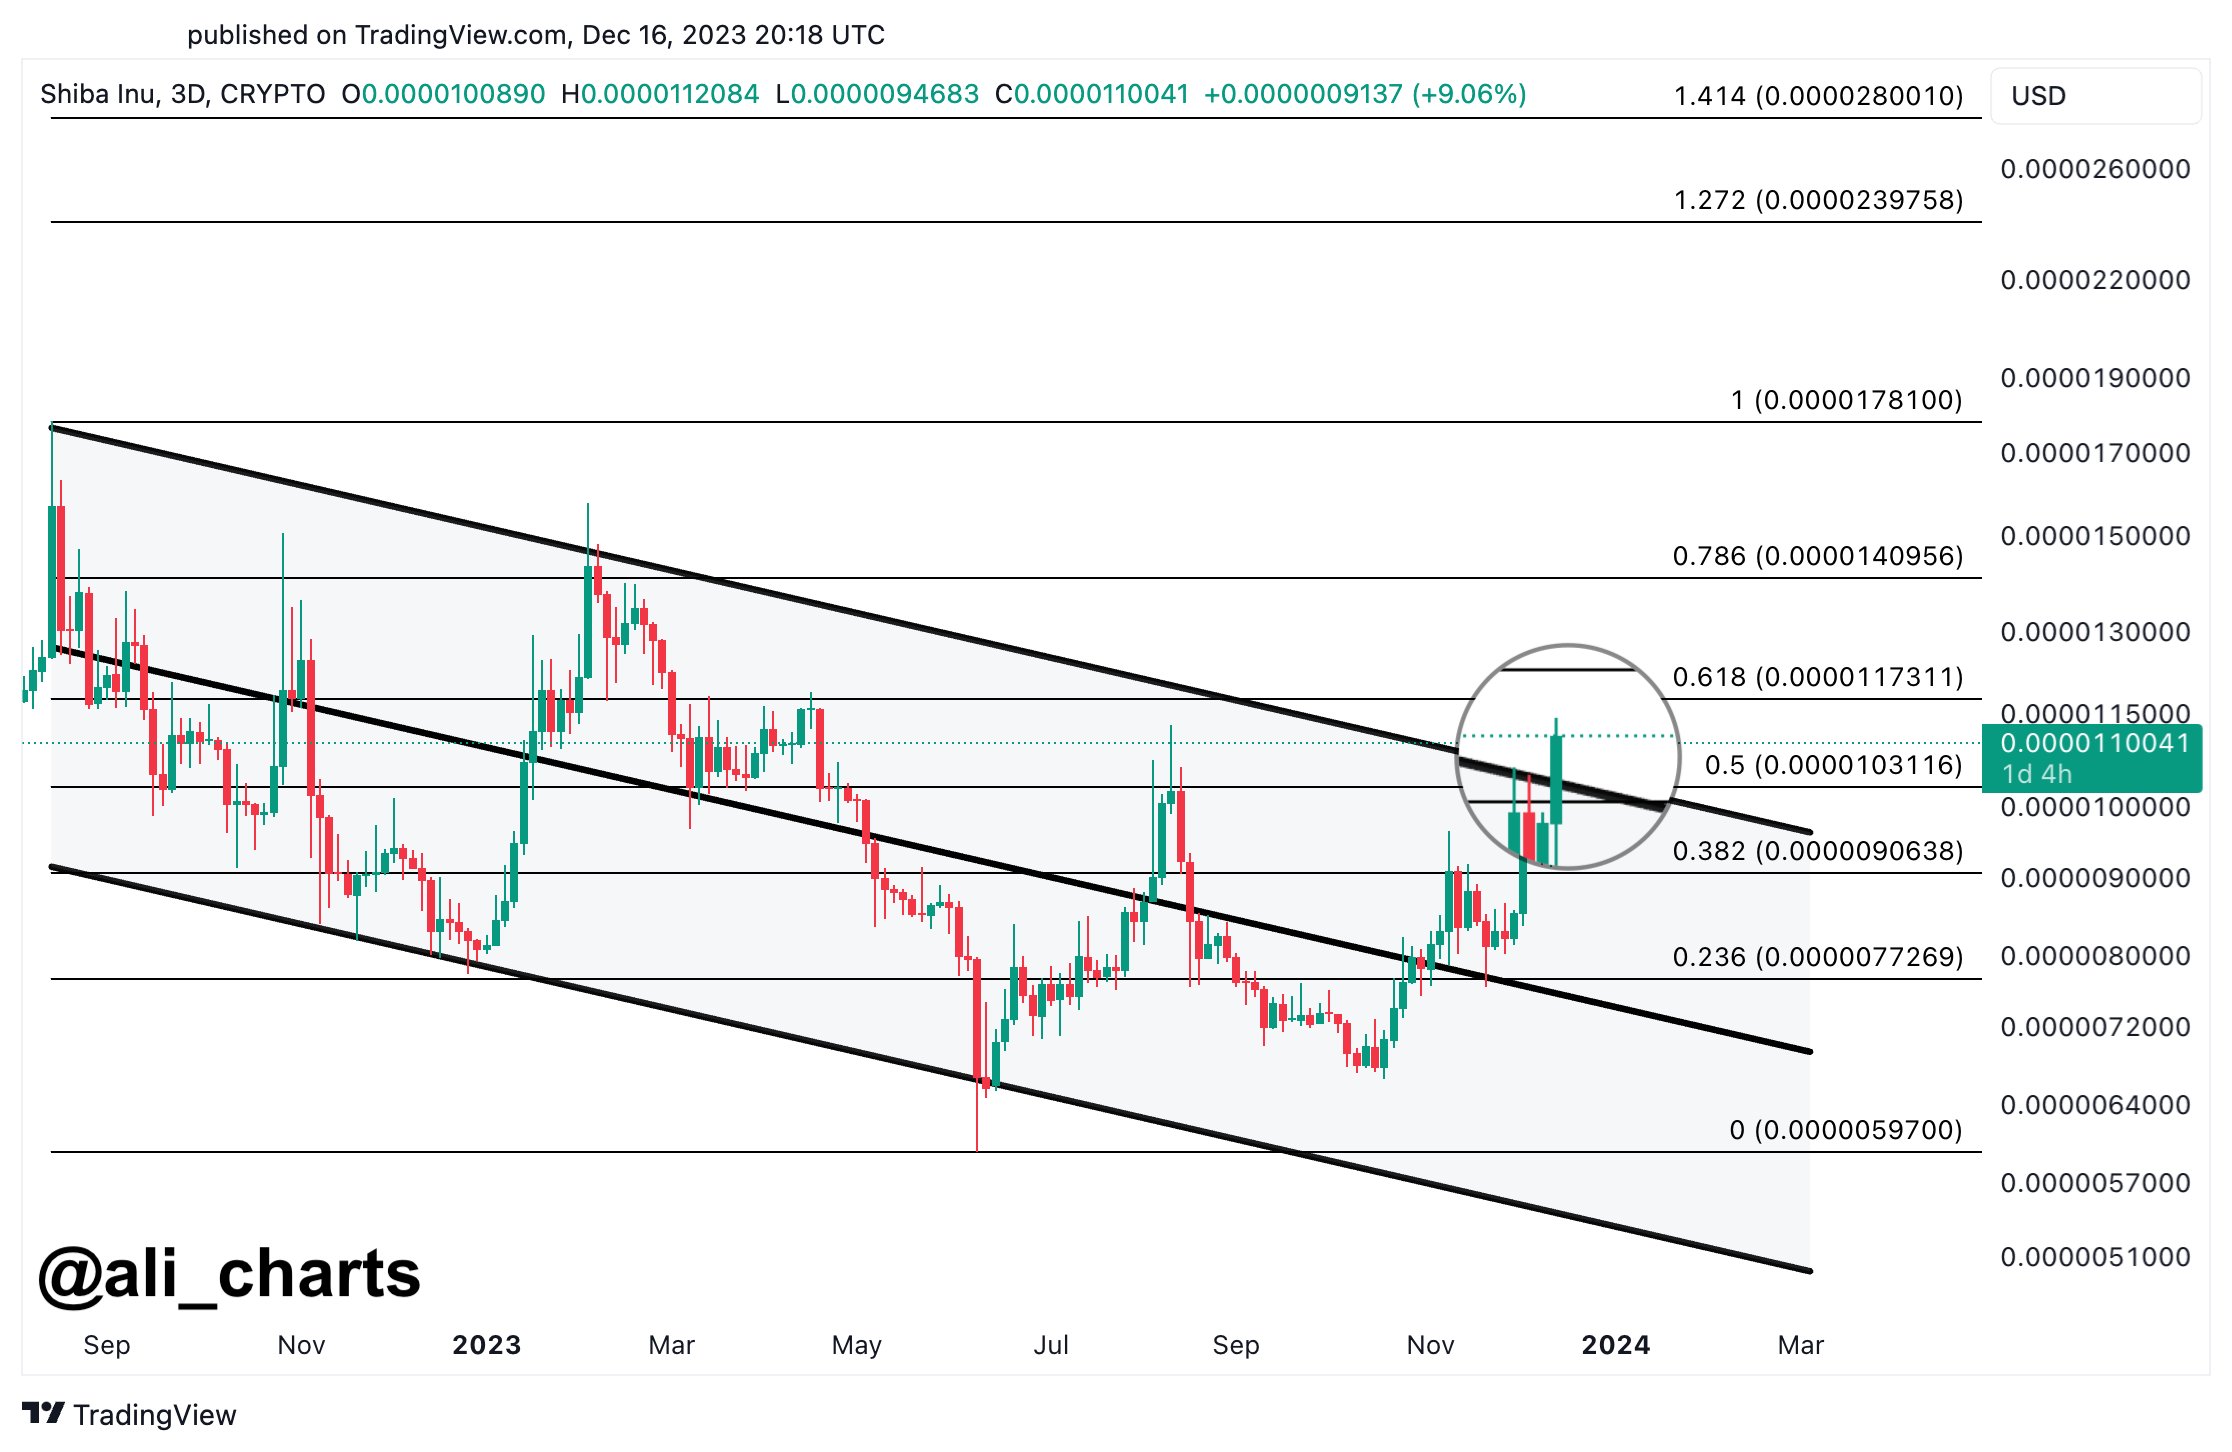
It is also worth noting that a Justin Sun account withdrew $6 million worth of SHIB from Binance in two transactions. Although withdrawals from centralized exchanges can cause supply shocks, there has not been a noticeable movement in the SHIB price.
SHIB Price Prediction: Breakout or Rejection?
Similarly to the daily chart, the 3-day one does not confirm the trend’s direction. The chart shows that the SHIB price has fallen under a descending parallel channel since August 2022. So far, the channel’s resistance and support trend lines have been validated numerous times.
While SHIB moved above the resistance trend line yesterday, it failed to sustain the increase and fell below it. This created a long upper wick (red icon), a sign of selling pressure. However, the meme coin still trades above the $0.0000100 horizontal area.
Whether the SHIB price breaks out from the channel or breaks down from the $0.0000100 area can determine the future trend’s direction.
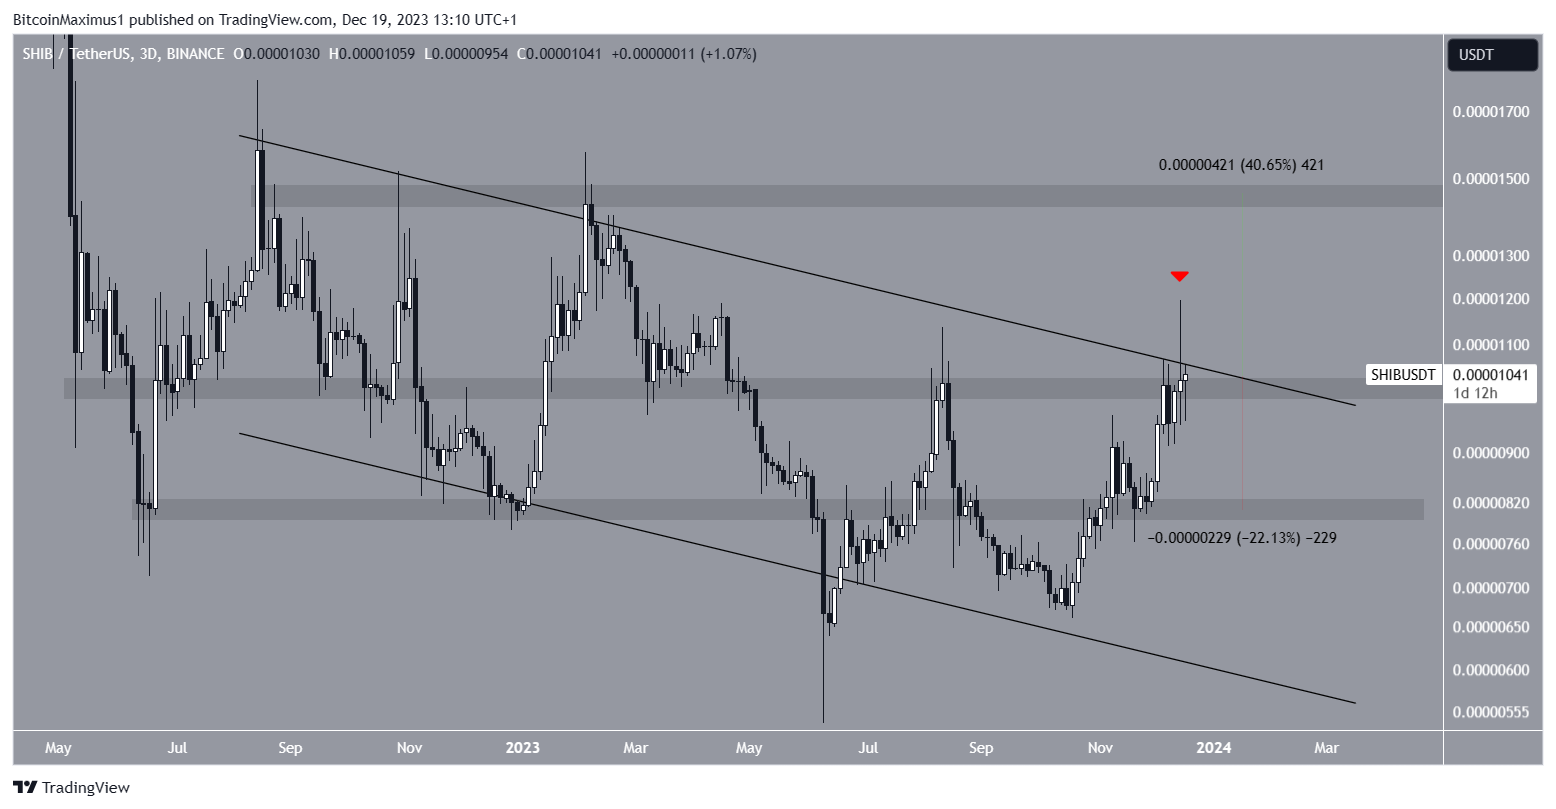
A breakout can trigger a 40% SHIB price increase to the next resistance at $0.0000145. On the other hand, a breakdown can cause a 22% drop to the closest support at $0.0000080.
For BeInCrypto‘s latest crypto market analysis, click here
Top crypto platforms in the US | December 2023
![]()
Coinbase
Coinbase” target=”_blank”>Explore →
![]()
iTrustCapital
iTrustCapital” target=”_blank”>Explore →
![]()
UpHold
UpHold” target=”_blank”>Explore →
![]()
eToro
eToro” target=”_blank”>Explore →
![]()
BYDFi
BYDFi” target=”_blank”>Explore →
Explore more
The post Justin Sun Withdrew $6 Million in Shiba Inu from Binance: How Will SHIB Price React? appeared first on BeInCrypto.