 at Support: A Crucial Price Standoff")
The Litecoin (LTC) price has broken down from a long-term ascending support line and is at risk of breaking down from a horizontal support area.
Whether LTC breaks down or bounces will likely determine the future trend’s direction.
Litecoin Price Hovers Inside Long-Term Support
The weekly timeframe technical analysis provides a mostly bearish outlook. The main reason for this is that the price broke down from the 427-day ascending support line in the second week of August. Breakdowns from such long-term structures often indicate that the previous trend is over and a new one has begun in the other direction.
Despite the breakdown, LTC still trades inside the $60 horizontal area. The area has intermittently acted as both support and resistance since May 2022. The area caused a bounce and created a long lower wick (green icon), considered a sign of buying pressure.
However, LTC also validated the previous ascending support line as resistance (red icon), a common movement after breakdowns.
Crypto investing, simplified. Get LTC price predictions here.
Whether the price breaks down from the $60 area or bounces is key in determining the future trend. A bounce and reclaim of the ascending support line can lead to a 55% increase to the long-term resistance at $100. On the other hand, a breakdown from the $60 area can lead to a 25% drop to the closest support at $50.
The weekly Relative Strength Index (RSI) is bearish, solidifying the downward trend. Traders utilize the RSI as a momentum indicator to assess whether a market is overbought or oversold, and to determine whether to accumulate or sell an asset.
If the RSI reading is above 50 and the trend is upward, bulls still have an advantage, but if the reading is below 50, the opposite is true. The indicator is below 50 and decreasing, both considered signs of a bearish trend.
While there are no important Litecoin news, $640 million in Bitcoin options will expire today. These could also have a significant effect on the LTC price.
Check Out the Best Upcoming Airdrops in 2023
LTC Price Prediction: Will Bullish Divergence Initiate Trend Reversal?
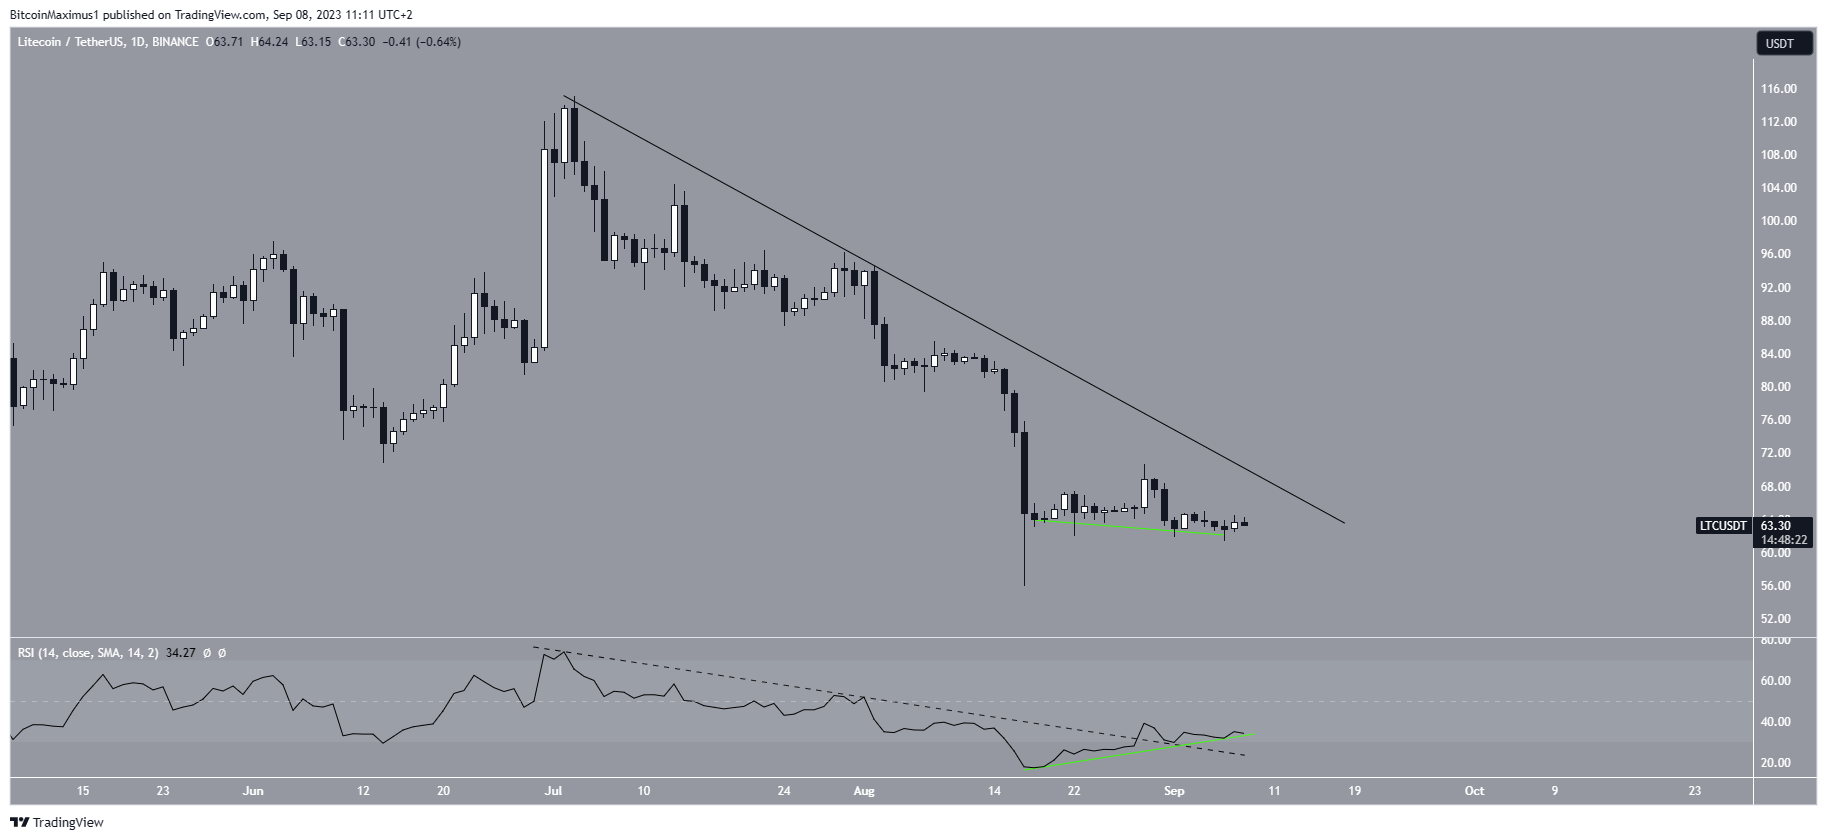
The daily timeframe analysis provides a mixed outlook.
On one hand, the price has fallen under a descending resistance line since its yearly high in July. This is a sign that the trend is bearish and new lows are likely to follow. As long as the line is in place, the trend can be considered bearish.
On the other hand, the daily RSI gives bullish signs. The indicator has broken out from its own trendline (dashed) and generated a significant amount of bullish divergence (green line). Furthermore, it has moved outside of its oversold territory. All these are considered bullish signs and could lead to an upward movement.
The fact that the RSI turned bullish at an important long-term horizontal support area further supports the possibility that a bullish reversal will begin soon.
However, until the price actually breaks out from the descending resistance line, the trend cannot be considered bullish.
To conclude, the LTC price prediction will be determined by whether the price breaks out from the descending resistance line or breaks down from the $60 area.
A 55% increase can occur in case of a breakout while a 25% drop is likely to follow if a breakdown occurs.
Check Out the Top 11 Crypto Communities To Join in 2023
For BeInCrypto’s latest crypto market analysis, click here
The post Litecoin (LTC) at $60 Support: A Crucial Price Standoff appeared first on BeInCrypto.