 Price Battles at Key Support – Will It Sink or Swim?")
The Litecoin (LTC) price failed to sustain a breakout above a long-term horizontal level and has returned to short-term support.
Will the Litecoin price bounce at this support, or will it break down and fall? Let’s find out!
Litecoin Struggles to Sustain Increase
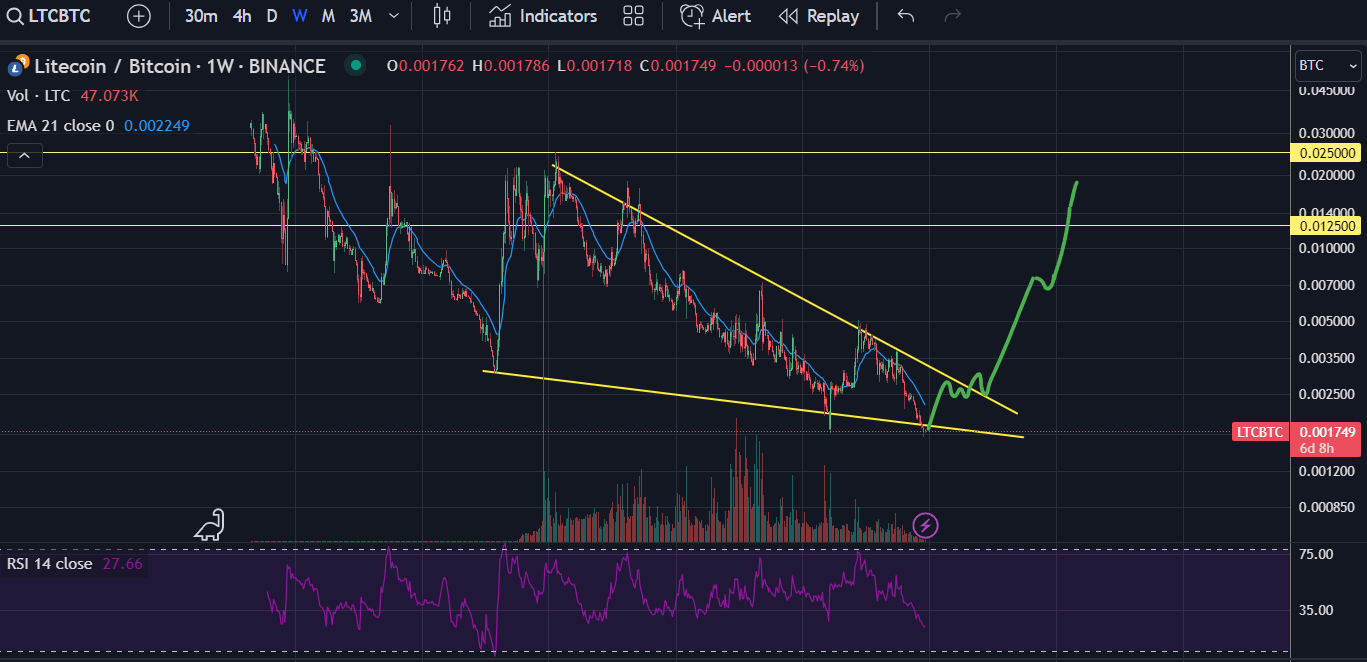
In the weekly timeframe analysis, Litecoin’s price shows a descent below a downward resistance trend line since April 2021, leading to a low of $40 in June 2022.
A subsequent upward movement in June 2023 led to a breakout from the trend line, but the increase was short-lived (red circle), resulting in a fall below the trend line. Another upward movement for LTC occurred in October, resulting in a breakout from the trend line at the start of November.
The price of LTC confirmed the trend line as a support level (green icon) and initiated an upward trajectory last week. However, this increase was also short-lived, and the price fell again this week.
Traders in the market utilize the Relative Strength Index (RSI) as a momentum indicator to identify overbought or oversold conditions, aiding in the decision-making process of accumulating or selling an asset.
RSI readings above 50 and an upward trend suggest a favorable position for bulls, while readings below 50 indicate the opposite. Currently, the RSI stands at 50, showing an undetermined trend.
Read more: 7 Best Litecoin (LTC) Wallets for 2023
What Are Analysts Saying?
Cryptocurrency traders and analysts on X are bullish for the future LTC price trend.
Xero Crypto noted that the GrayScale Litecoin trust is front-running the altcoin and suggests the LTC price will catch up soon. He tweeted:
Grayscale $LTC trust is already valued at over $100 per coin. Time for spot price to catch up
JoaoDevesa believes that the LTC price will outperform Bitcoin (BTC) because of the breakout from a descending wedge pattern.
Fernando Sperandio is of the same mind but noted an inverse head and shoulders pattern for the future trend.
Read more: How To Buy Litecoin (LTC) in 4 Easy Steps
LTC Price Prediction: Bounce or Breakdown?
The daily timeframe also gives an undetermined reading. This is because of the price action and RSI readings.
While the LTC price broke out from a descending resistance trend line and the $68 resistance area, it failed to sustain its increase. The price has fallen since December 9, deviating above the $76 horizontal resistance area. Now, it has nearly reached the $68 support.
Similarly to the weekly time frame, the daily RSI gives an undetermined reading since it is right at 50. As a result, the reaction to the $68 area will likely determine the future trend.
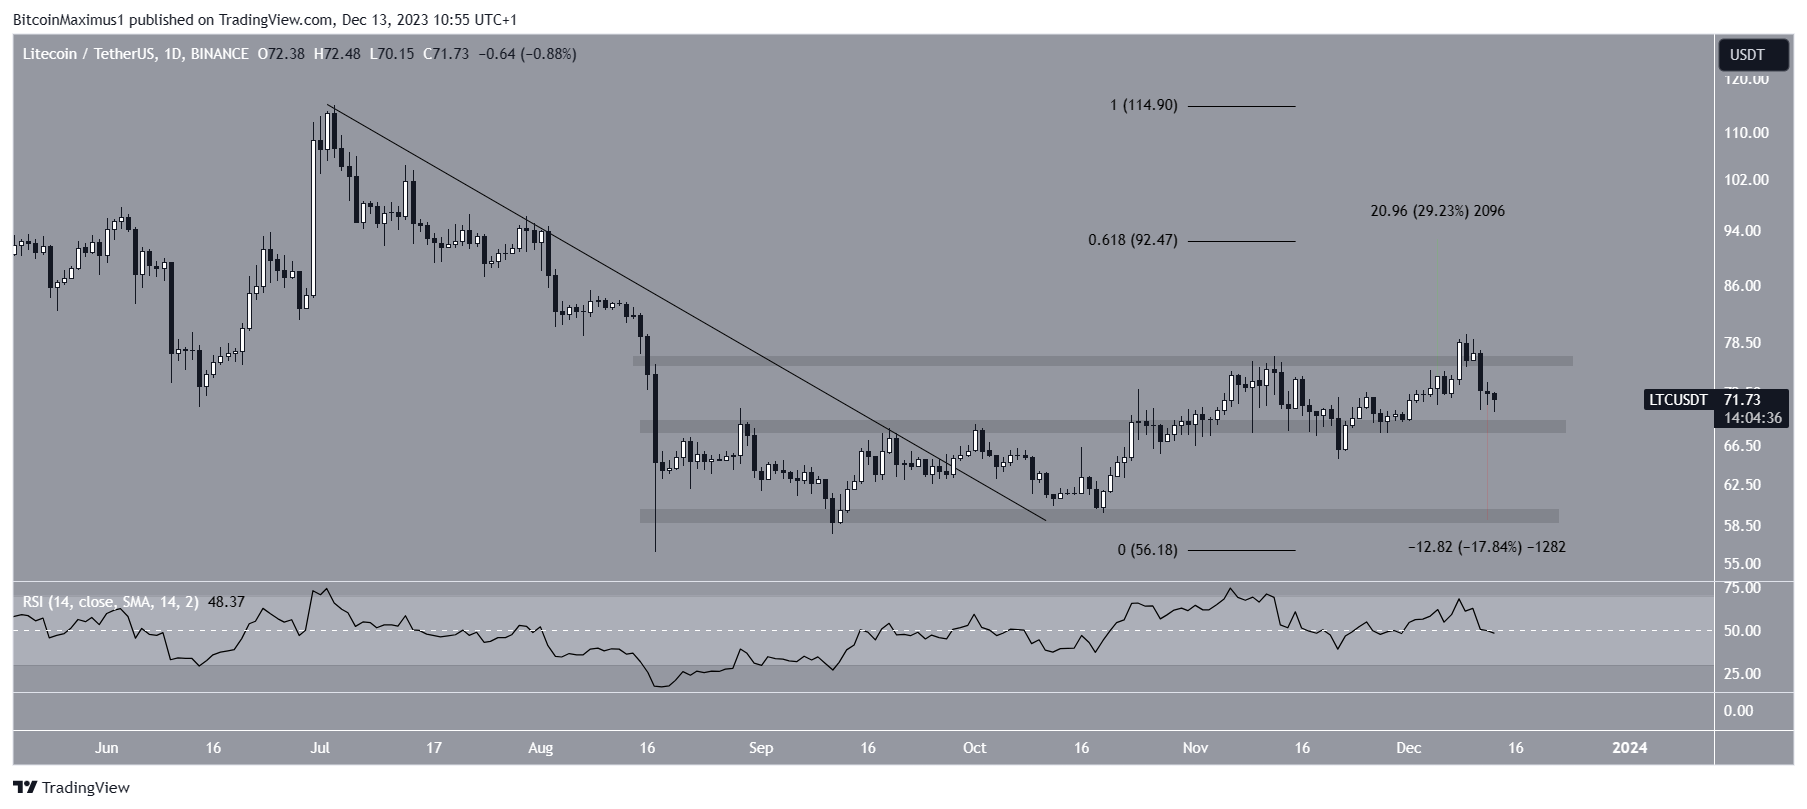
If the Litecoin price breaks below $68, it can decrease by 18% to the next support at $58. However, if LTC bounces and breaks out above $76, a 30% increase to the next resistance at $92.50 will be expected.
Read More: Top 9 Telegram Channels for Crypto Signals in 2023
For BeInCrypto’s latest crypto market analysis, click here.
Top crypto platforms in the US | December 2023
![]()
Coinbase
Coinbase” target=”_blank”>Explore →
![]()
iTrustCapital
iTrustCapital” target=”_blank”>Explore →
![]()
UpHold
UpHold” target=”_blank”>Explore →
![]()
eToro
eToro” target=”_blank”>Explore →
![]()
BYDFi
BYDFi” target=”_blank”>Explore →
Explore more
The post Litecoin (LTC) Price Battles at Key Support – Will It Sink or Swim? appeared first on BeInCrypto.