The PEPE price broke out from a short-term descending resistance trend line but trades under a long-term one.
PEPE Approaches Long-Term Resistance
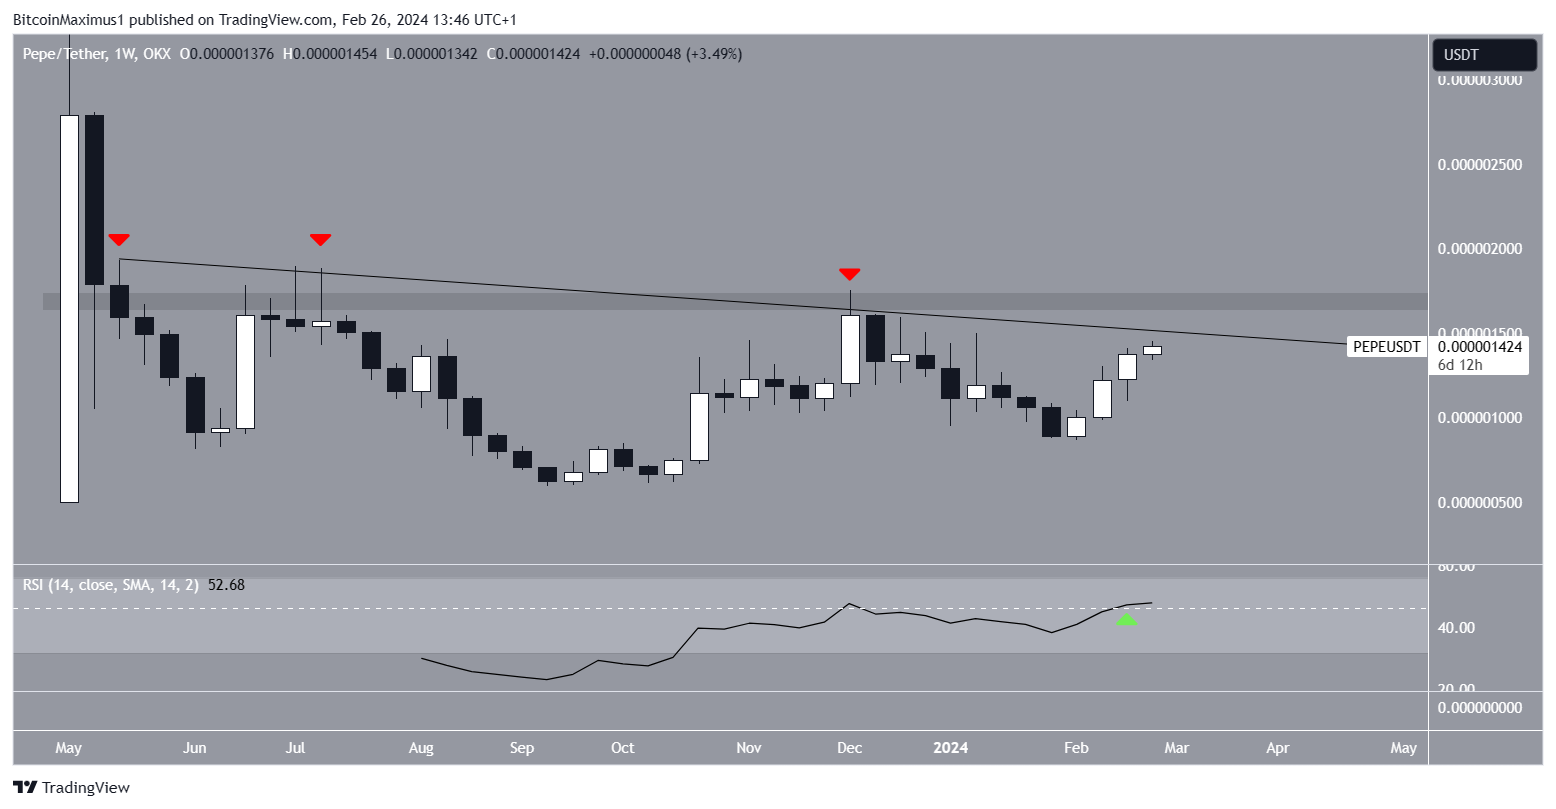
The technical analysis of the weekly time frame shows the PEPE price has decreased under a long-term descending resistance trend line since May 2023. The decrease led to a low of $0.00000059 in September. The PEPE price has increased since.
Until now, PEPE has made three unsuccessful attempts at breaking out (red icons). It has nearly reached the resistance trend line to make its fourth attempt.
The weekly Relative Strength Index (RSI) is bullish. When evaluating market conditions, traders use the RSI as a momentum indicator to determine whether a market is overbought or oversold and whether to accumulate or sell an asset.
If the RSI reading is above 50 and the trend is upward, bulls still have an advantage, but if the reading is below 50, the opposite is true. The indicator is trending upward and just moved above 50 (green icon), both signs of a bullish trend.
Read More: Pepe: A Comprehensive Guide to What It Is and How It Works
What Are Analysts Saying?
Cryptocurrency traders and analysts on X positively view the future PEPE trend.
Bluntz Capital believes PEPE has completed its correction and started a new upward movement.
JJcycles suggests that PEPE will lead the upcoming Memecoin season while FLOKI will follow in its footsteps. Crypto Michael noted a descending resistance line, stating that a breakout from it can accelerate the upward movement.
Read More: 5 Best Pepe (PEPE) Wallets for Beginners and Experienced Users
PEPE Price Prediction: Will the Upward Movement Continue?
A closer look at the daily time frame suggests the PEPE price will continue increasing because of the price action and wave count. The price action shows that PEPE broke out from a descending resistance trend line and validated it as support afterward (green icon). These are both considered bullish signs.
The wave count indicates PEPE has completed an upward movement (white) and ensuing correction (black). Utilizing the Elliott Wave theory, technical analysts examine long-term price patterns and investor psychology that recur to determine the direction of a trend. If both upward movements have the same length, PEPE can increase by another 40% and reach the next resistance at $0.00000200.
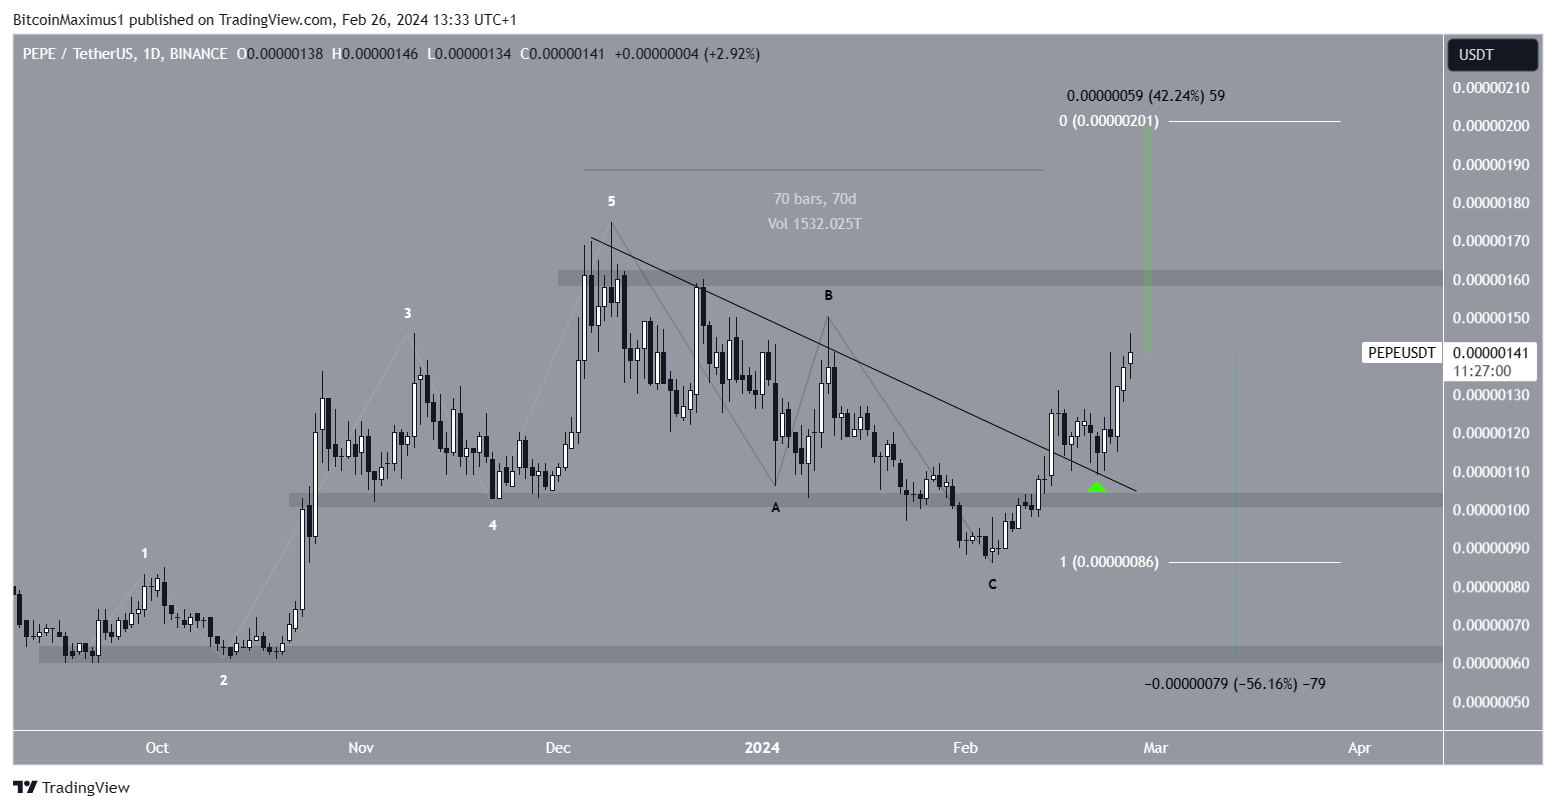
Despite the bullish PEPE price prediction, closing below the $0.00000105 support area will invalidate the bullish count. Then, PEPE can fall 55% to the closest support at $0.00000060.
Read More: How To Buy Pepe (PEPE) and Everything You Need To Know
For BeInCrypto‘s latest crypto market analysis, click here.
The post PEPE Price Approaches Long-Term Resistance – Can It Reach New All-Time High? appeared first on BeInCrypto.