 Faces Price Consolidation: Is a Downtrend Imminent?")
Polkadot’s (DOT) latest indicators signal potential price consolidation is coming. A bearish death cross just formed in the price chart, reinforcing that a bullish trend shouldn’t appear soon.
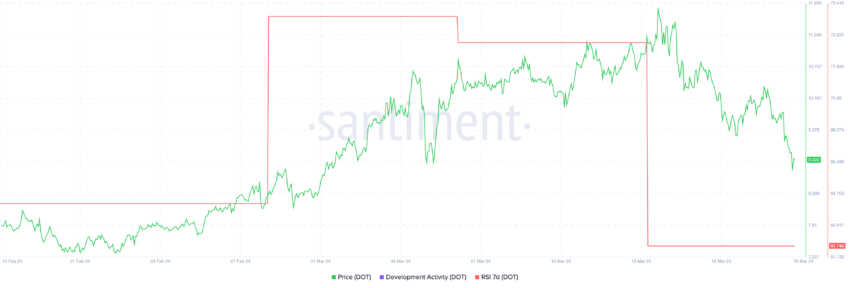
Development Activity has decreased for 13 days in a row, indicating that DOT is losing its momentum. These metrics, alongside RSI, suggest that Polkadot’s price support level at $8.30 could be tested soon.
Development Activity Has Decreased for 13 Days in a Row
Historically, DOT Development Activity was pretty correlated with its price. However, in 2024, it’s possible to see a moment where this correlation is detached. Between January 14 to January 31, Development Activity grew by 8.45%. However, in that same period, the DOT price went from $7.33 to $6.64.
Then, between February 11 and February 19, we had another occurrence of that phenomenon. DOT price grew from $7.01 to $8.03. At the same time, Development Activity decreased by 12%. This detachment between these two metrics indicates that DOT price had all that growth in 2024 – from $8.60 on January 1 to $11.6 on March 13 – due to external factors. These factors could not be directly related to its fundamentals, such as the overall crypto bull run.
However, even if that happens sometimes, usually the development activity is a good proxy for price movement. Development activity on this layer-0 blockchain has been decreasing for the last 13 days in a row. This indicates that the network is not able to keep its momentum and attract builders. This could deeply affect its price as the network loses its momentum and buyers move on to other assets.
Read More: Polkadot (DOT) Price Prediction 2024/2025/2030
RSI Could Indicate Price Stagnation
During DOT price surge between February 28 to March 14, when its price went from $8.45 to $11.72, its RSI 7D was consistently above 70.
The Relative Strength Index (RSI) is a momentum oscillator used to measure the speed and change of price movements. It oscillates between 0 and 100 and is typically used to identify overbought or oversold conditions.
For DOT, an RSI of 61 falls into the higher end of the neutral zone, which ranges from 30 to 70. Being above 50, an RSI of 61 suggests that recent price gains are greater than the losses, indicating a bullish momentum for the asset. It shows that buying pressure has been stronger than selling pressure, but it is not yet at the overbought threshold (typically set at 70).
Investors might view an RSI around this level as a positive sign, though not extreme enough to trigger concerns of an imminent reversal due to overbuying.
However, the RSI alone may not be the best indicator to state that DOT will enter a bullish trend since other indicators, such as development activity and EMA lines, are painting a bearish scenario. This conjecture of signals may lead DOT into a consolidation phase soon.
DOT Price Prediction: Further Correction of 13% Possible
In Polkadot’s 4-hour price chart, a short-term EMA line just crossed below one long-term EMA line. When this happens, it’s referred to as a “death cross” and is often interpreted as a bearish signal, suggesting that the asset could be entering a downtrend. Not all short-term EMAs have crossed below the long-term ones, indicating that the trend has not fully turned bearish yet.
Exponential Moving Averages (EMAs) are technical analysis tools that smooth out price data to identify trends. Unlike simple moving averages (SMAs), EMAs give more weight to recent prices, which makes them more responsive to new information.
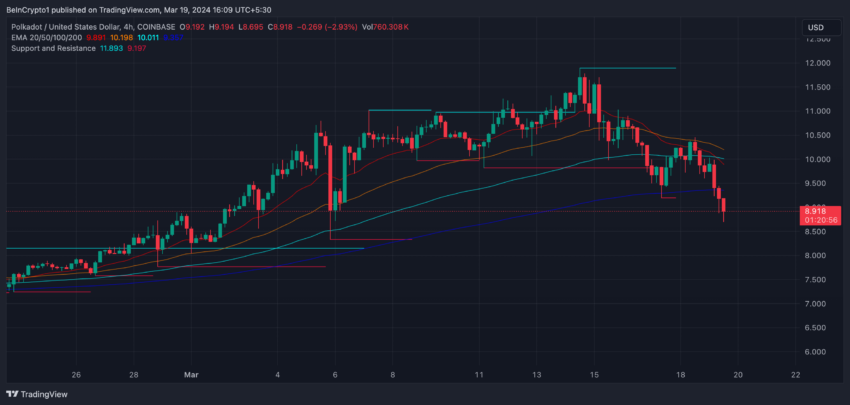
Regarding the DOT price analysis, the chart shows that the price is currently in a downtrend, having recently fallen below the 20-day EMA. The support zone around $8.33 is critical; if the price falls below this level, it could indicate further declines, with the next support potentially around $7.75. This would be consistent with the bearish signal from the death cross. That would represent a 13.7% correction.
Read More: How To Stake Polkadot (DOT)
Conversely, if the price finds sufficient buying interest to reverse the trend, the first significant resistance it might encounter is around $11. This level previously acted as a support, which might now serve as resistance. If an uptrend is strong enough to break through that, the next major resistance level could be at $11.9. That would be a 32% price growth for DOT.
The post Polkadot (DOT) Faces Price Consolidation: Is a Downtrend Imminent? appeared first on BeInCrypto.