The Polkadot (DOT) price has been in a bearish trend for most of the year. In September, the price decreased from the $4.30 horizontal support area.
The $4.30 area is now expected to provide resistance. The next closest support area is found by using Fib levels.
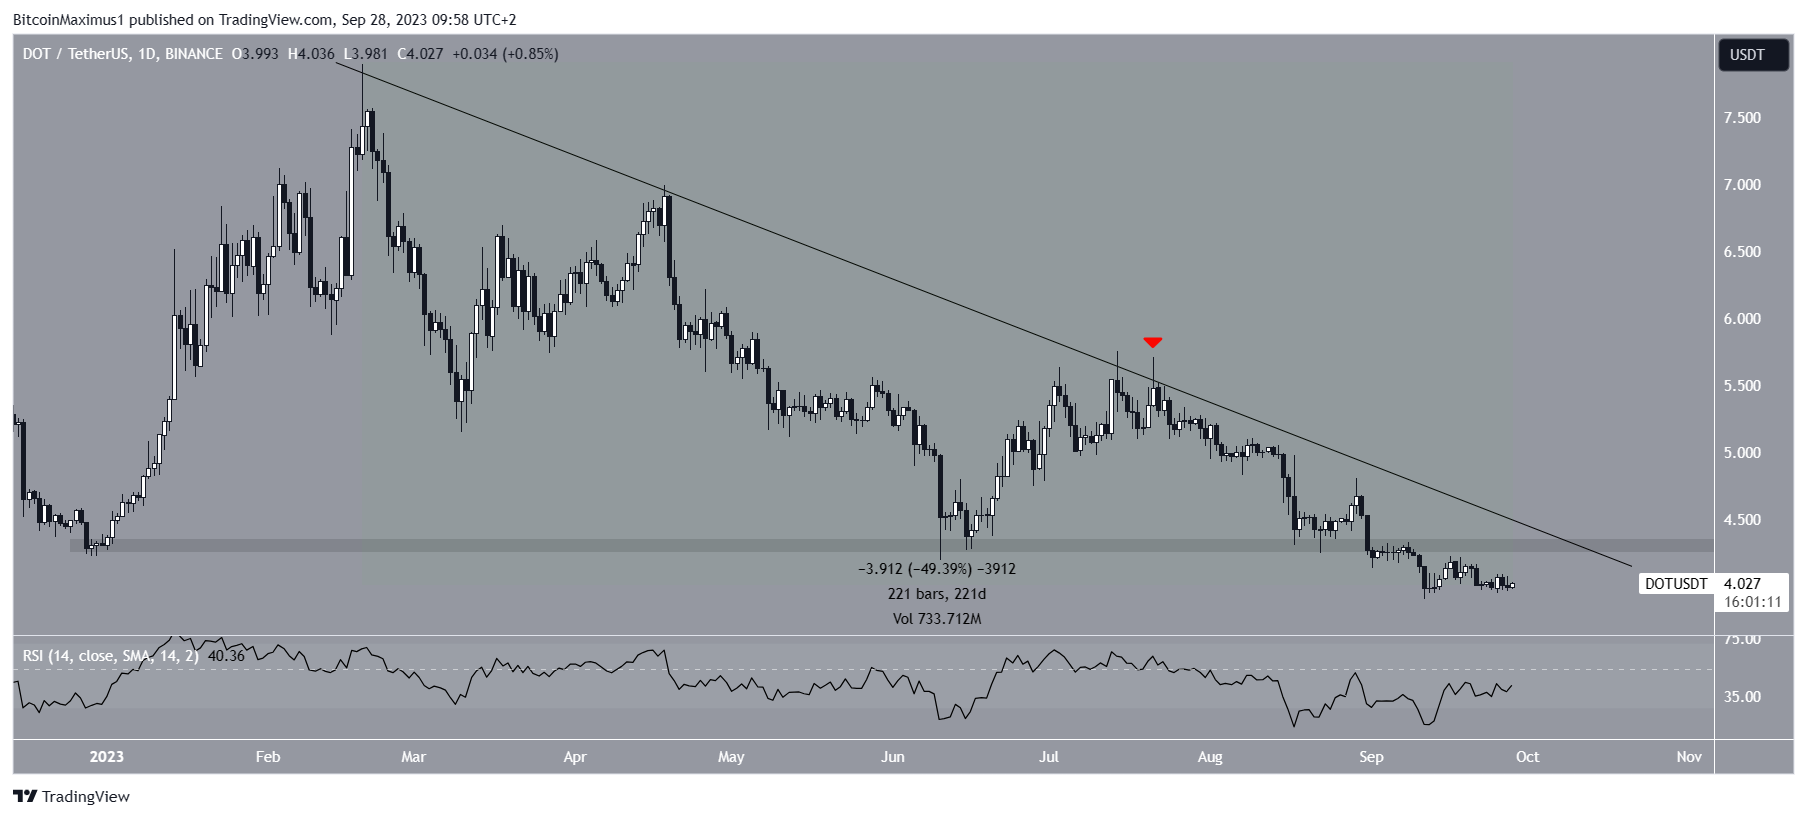
Polkadot Falls Under Descending Resistance Trendline
The DOT price has fallen since reaching a new yearly high of $7.90 in February. The decrease has been contained below a descending resistance trendline. During the 221 days it has traded under this line, DOT fell by 50%.
More recently, the line caused a rejection on July 21 (red icon), accelerating the rate of decrease.
Read More: 9 Best Crypto Demo Accounts For Trading
September had another bearish sign since the Polkadot price broke down from the $4.30 horizontal support area.
This was a crucial area since it had provided support since the beginning of the year. The area is now expected to provide resistance in case the price bounces.
The daily RSI is leaning bearish. With the RSI as a momentum indicator, traders can determine whether a market is overbought or oversold and decide whether to accumulate or sell an asset.
Bulls have an advantage if the RSI reading is above 50 and the trend is upward, but if the reading is below 50, the opposite is true. Even though the indicator is moving upwards, it is still below 50, a sign of a bearish trend.
DOT Price Prediction: Where to Next After Breakdown?
The $4.30 area is the final horizontal support level before the all-time low of $2.69.
Therefore, using a Fib retracement tool is necessary to determine the next closest support levels.
The principle behind Fibonacci retracement levels suggests that after a considerable price movement in one direction, the price will retrace or return partially to a previous price level before continuing in its original direction.
Read More: Top 9 Telegram Channels for Crypto Signals in 2023
These levels can be utilized to identify the highest point of potential future upward movements. The 1.27 external Fib of Polkadot’s most recent increase is $3.18, while the 1.61 is $1.90.
The former is 20% below the current price, while the latter is 50% below it. So, if the downward movement continues, these levels will likely provide support.
Similarly to the daily timeframe, the weekly RSI is below 50 and falling, both considered signs of a bearish trend.
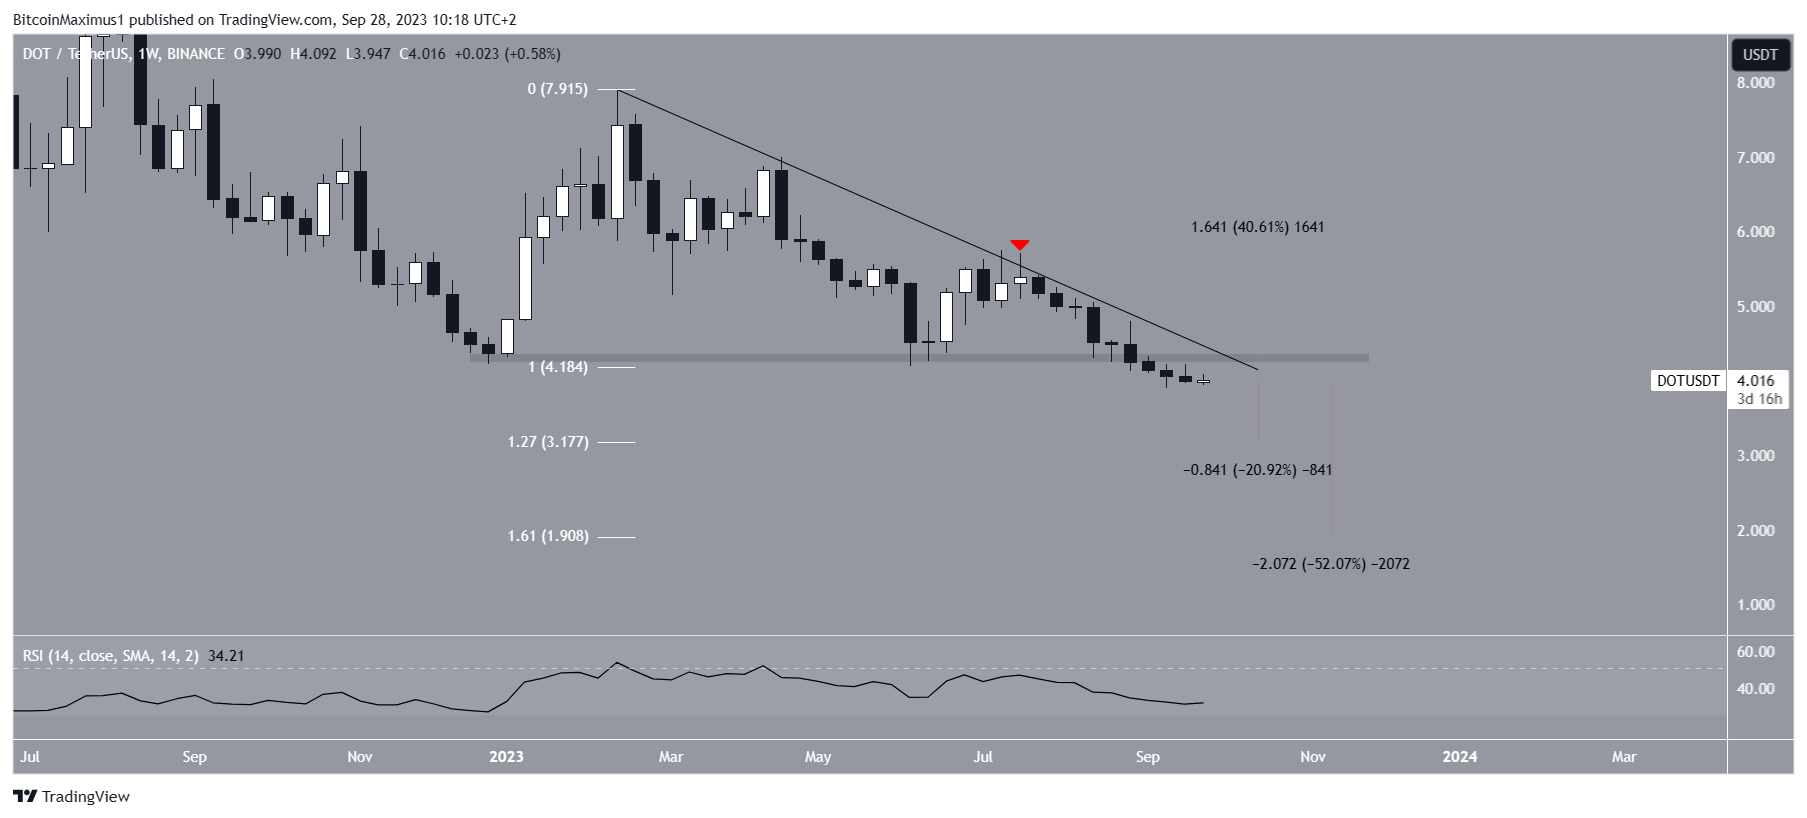
Despite this bearish DOT price prediction, a breakout above the $4.30 area and the descending resistance trendline will invalidate the bearish outlook.
In that case, the cryptocurrency could increase by 40% to the next resistance at $5.70.
For BeInCrypto’s latest crypto market analysis, click here
The post Polkadot (DOT) Price Has Fallen by 50% Since February – When Will the Decrease Stop? appeared first on BeInCrypto.