 Road to Recovery: Is a Potential 60% Gain Ahead?")
The Polygon (MATIC) price broke out from a short-term descending wedge and is attempting to clear a long-term descending resistance line.
Doing so could lead to a significant price increase, while a rejection from the line will likely catalyze a drop toward the closest horizontal support area.
Polygon Price Struggles Below Resistance
The technical analysis in the daily timeframe for MATIC shows that the price has fallen under a descending resistance line since February 28, when it reached its yearly high of $1.57.
While following the line, the price decreased from the $0.60 horizontal support area. Then, it validated the area as resistance on August 29 (red icon).
The validation simultaneously touched the descending resistance line for the final time, another sign of a bearish trend. The price has not reached the line since.
Transform your crypto game with predictive insights. Visit now.
If the MATIC price breaks out from the line, it can increase by 60% and reach the $0.85 horizontal resistance area. However, if it gets rejected again, a 35% drop to the closest support at $0.35 will likely be the future movement.
Even though the price action is bearish, the daily Relative Strength Index (RSI) gives signs of a potential bullish trend reversal.
Traders use the RSI as a momentum gauge to identify whether a market is overbought or oversold. This aids them in making decisions regarding asset accumulation or liquidation. An RSI reading above 50 during an upward trend provides an advantage to bulls. While a reading below 50 implies the opposite scenario.
While the indicator is still below 50, it is increasing. More importantly, it has generated significant bullish divergence (green line). This occurs when a momentum increase accompanies a price decrease.
It often leads to bullish trend reversals. In the case of MATIC, it would be expected to cause a breakout from the long-term descending resistance line.
The bankrupt FTX exchange posted a list of assets that were approved for liquidation, and MATIC was not among them.
Read More: Best Crypto Sign-Up Bonuses in 2023
MATIC Price Prediction: Will Short-Term Breakout Catalyze Increase?
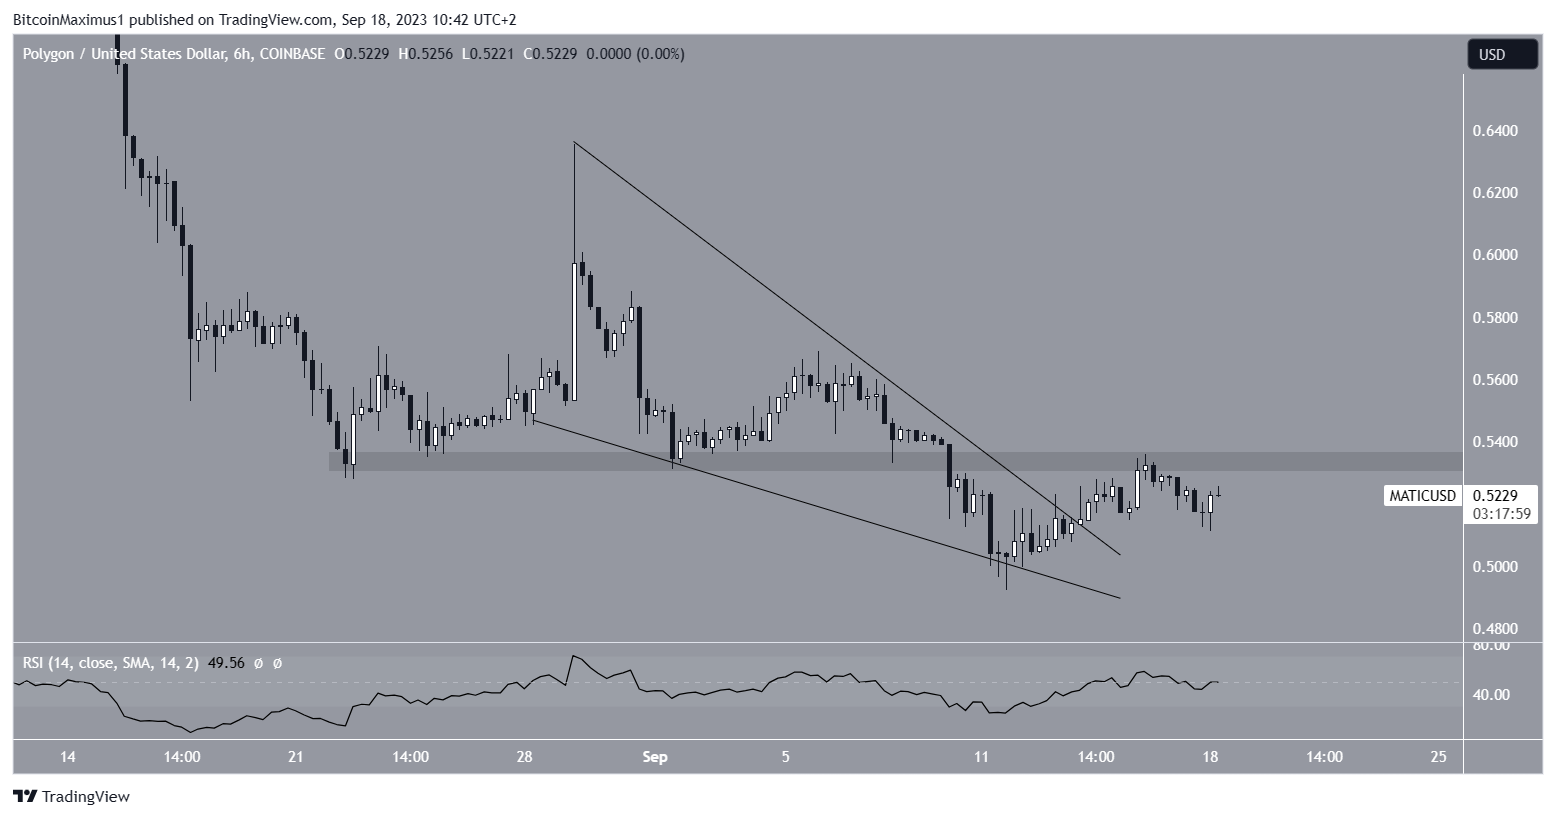
A look at the shorter-term six-hour timeframe suggests that the price will successfully break out from the long-term resistance line. The main reason for this is that the price has already broken out from a short-term descending wedge. The wedge is considered a bullish pattern and could catalyze the breakout from the long-term resistance line.
The six-hour RSI supports the ongoing price increase and movement above the long-term resistance line. The indicator is moving upwards and just increased above 50.
The main remaining obstacle is the minor resistance at $0.53. Once MATIC clears it, it will likely increase toward the resistance above at $0.85.
Therefore, the most likely MATIC price prediction is a breakout from the resistance line and an increase towards $0.85. However, if the price gets rejected from the resistance line, a 35% drop to the $0.35 horizontal support area will likely be the future price movement.
Interested in AI Trading? 9 Best AI Crypto Trading Bots to Maximize Your Profits
For BeInCrypto’s latest crypto market analysis, click here.
The post Polygon (MATIC) Road to Recovery: Is a Potential 60% Gain Ahead? appeared first on BeInCrypto.