XRP has staged a sharp recovery from the $1.00 area, breaking above its long-standing descending structures on both the USD and BTC charts. However, the rally has now reached major resistance, making the current levels critical for the next directional move.
Ripple Price Analysis: The USDT Pair
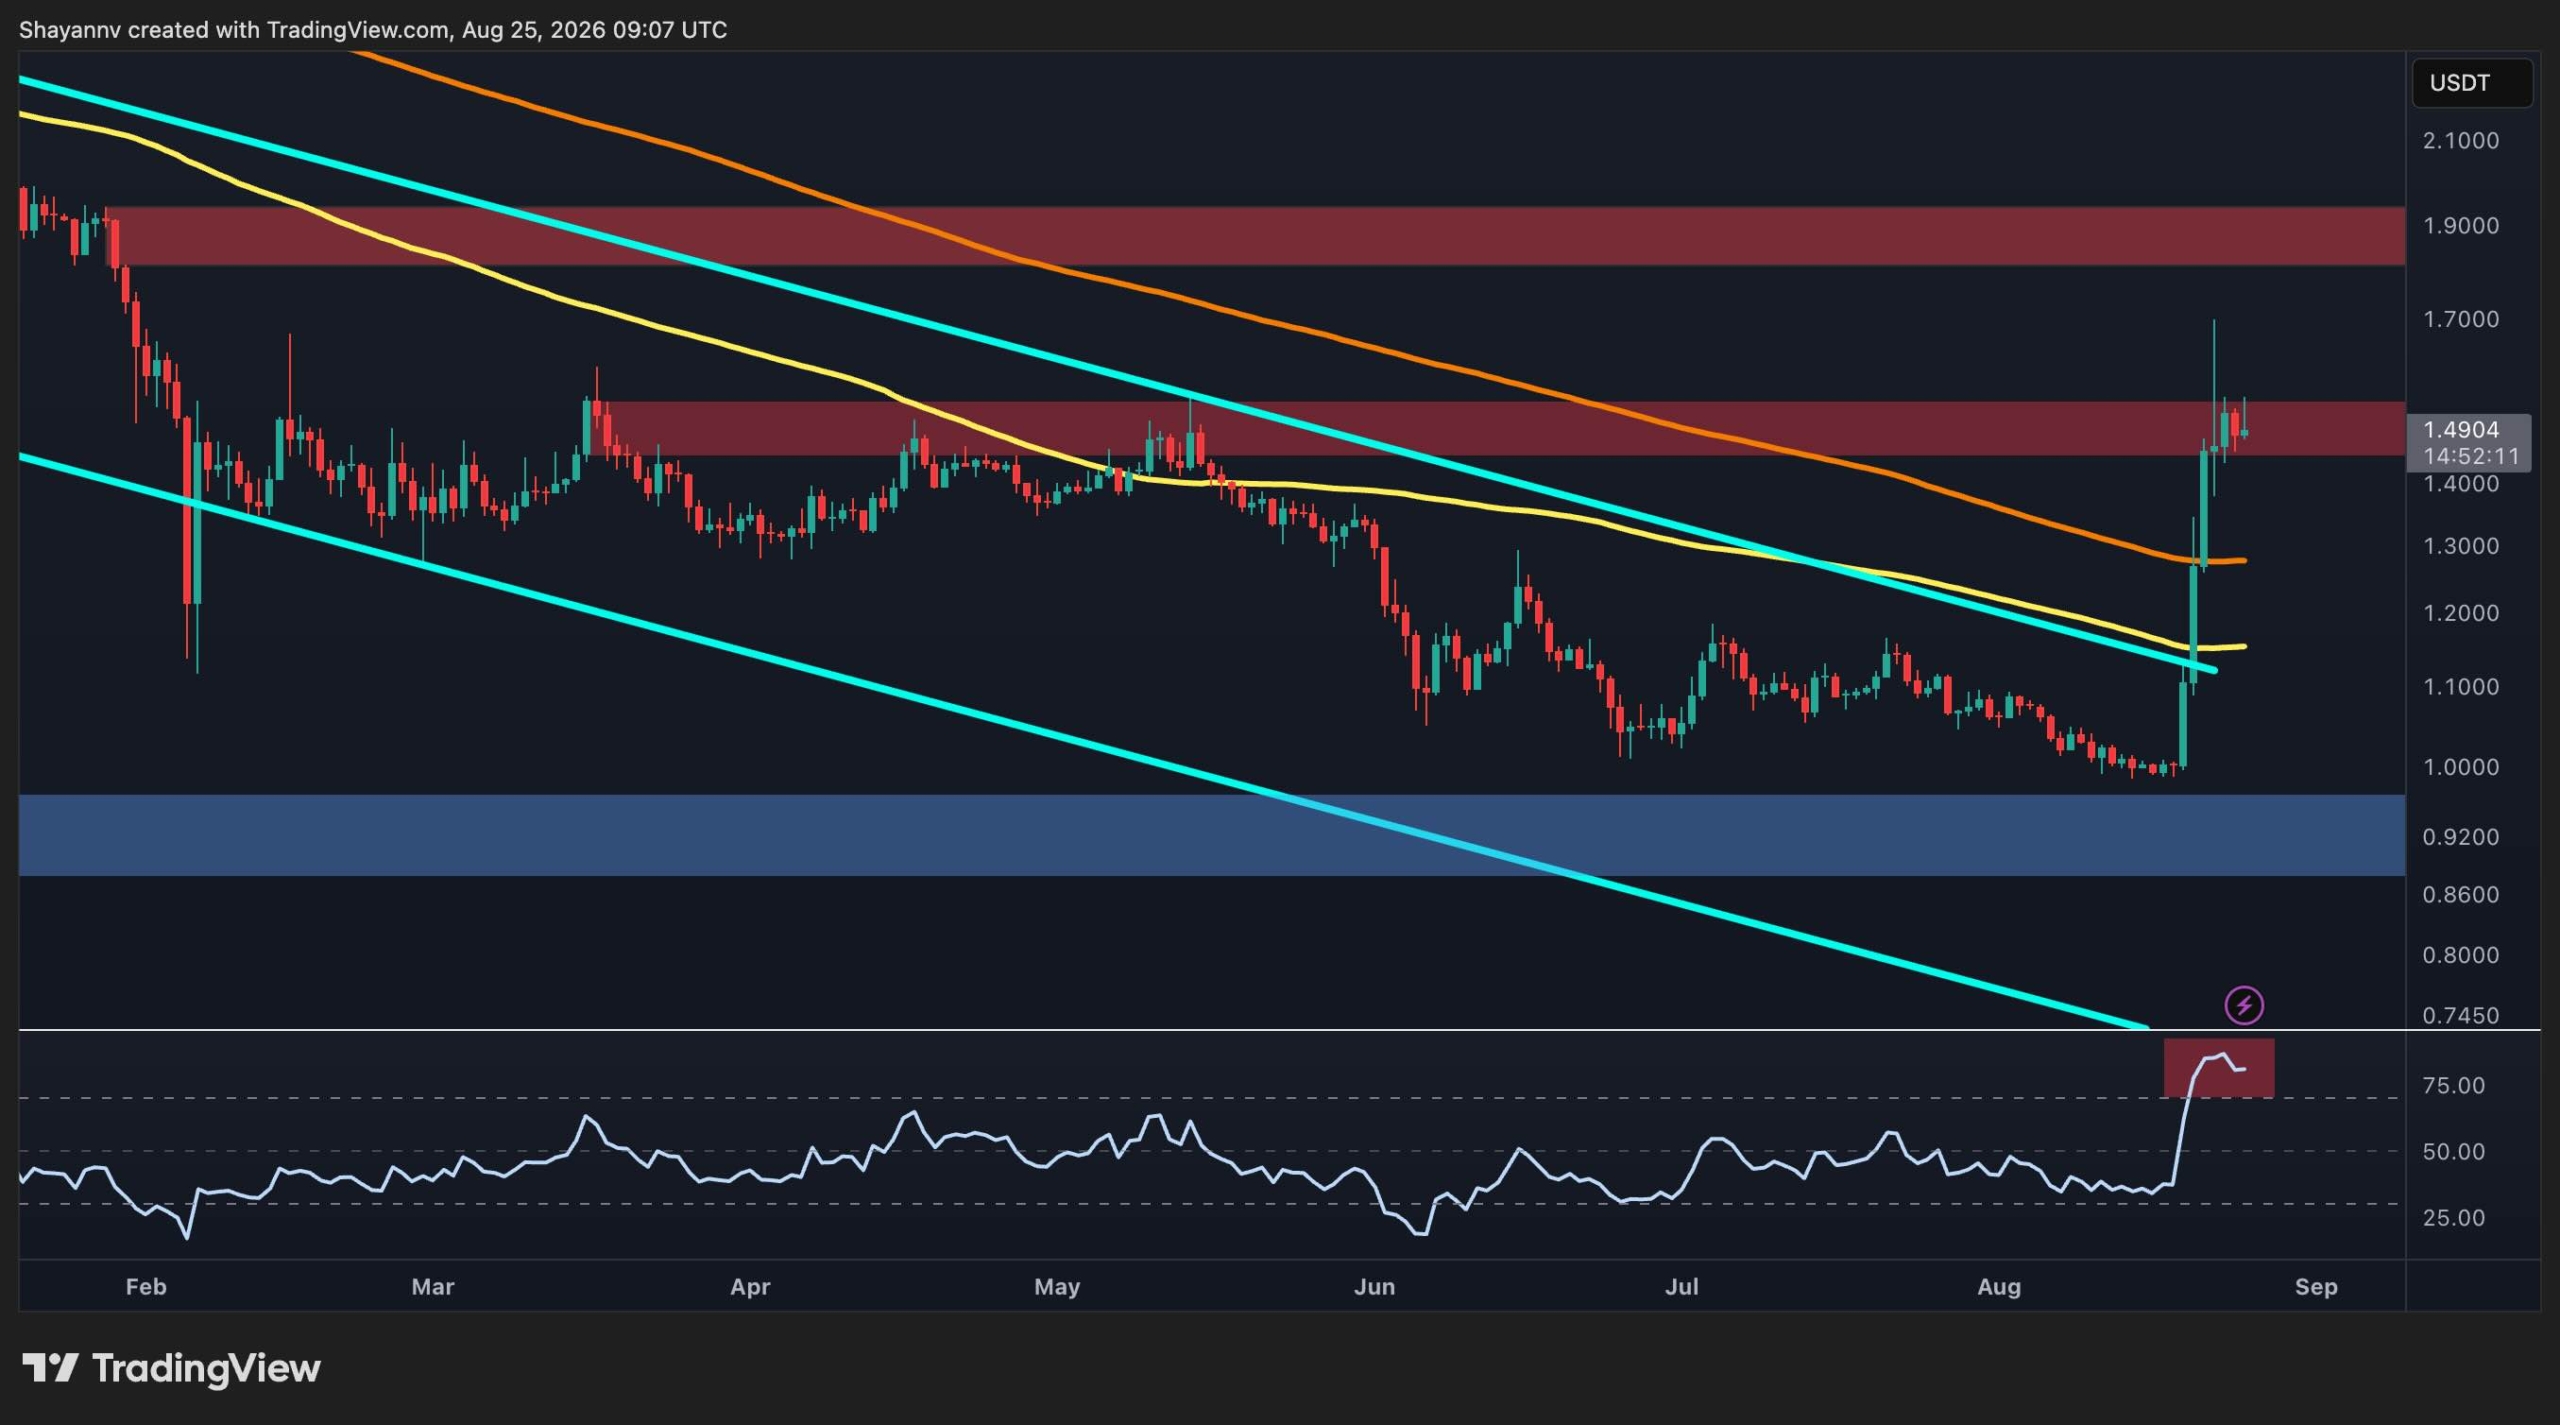
The asset broke above its broad descending channel after finding support around $1.00. It has since reclaimed the 100-day and 200-day moving averages, located around $1.2 and $1.3, respectively. The move above $1.3 has turned both of these former resistance elements into near-term support.
The rally is now testing the critical $1.50 resistance zone, where the price has started to consolidate. A daily breakout above $1.50 could open the door toward the $1.80-$1.90 area. Conversely, a rejection followed by a move below $1.30 would weaken the breakout structure and raise the risk of a deeper correction, and even potentially back toward the $1 area.
The RSI has also surged above 70 and still remains extremely elevated in the overbought region. This highlights strong momentum but also leaves room for a short-term cooldown, which could lead to a retest of the 200-day moving average.
The BTC Pair
On the XRP/BTC daily chart, it is evident that the price has attempted to break out of its broad descending channel after bottoming near 1,500 sats. However, unlike the USDT pair, the breakout has so far failed. The pair briefly pushed above the channel’s upper boundary before printing a large rejection wick, signaling that sellers remain active around this resistance.
XRP/BTC is now retracing toward the previously broken 200-day moving average, which is being tested as potential support. The reaction around this moving average could be important for the next move. If XRP/BTC manages to hold above it and establishes the former breakout area as support, another attempt at the 2,000 sats resistance zone could follow.
A successful break above 2,000 sats would strengthen the relative-strength outlook, while a decisive loss of the 200-day moving average would suggest that the recent breakout attempt was a false move and could expose the pair to further downside. The RSI has also pulled back after briefly moving above 70, reflecting the loss of momentum following the failed breakout, and indicating that a further consolidation or correction could materialize in the coming weeks.

Disclaimer: Information found on CryptoPotato is those of writers quoted. It does not represent the opinions of CryptoPotato on whether to buy, sell, or hold any investments. You are advised to conduct your own research before making any investment decisions. Use provided information at your own risk. See Disclaimer for more information.