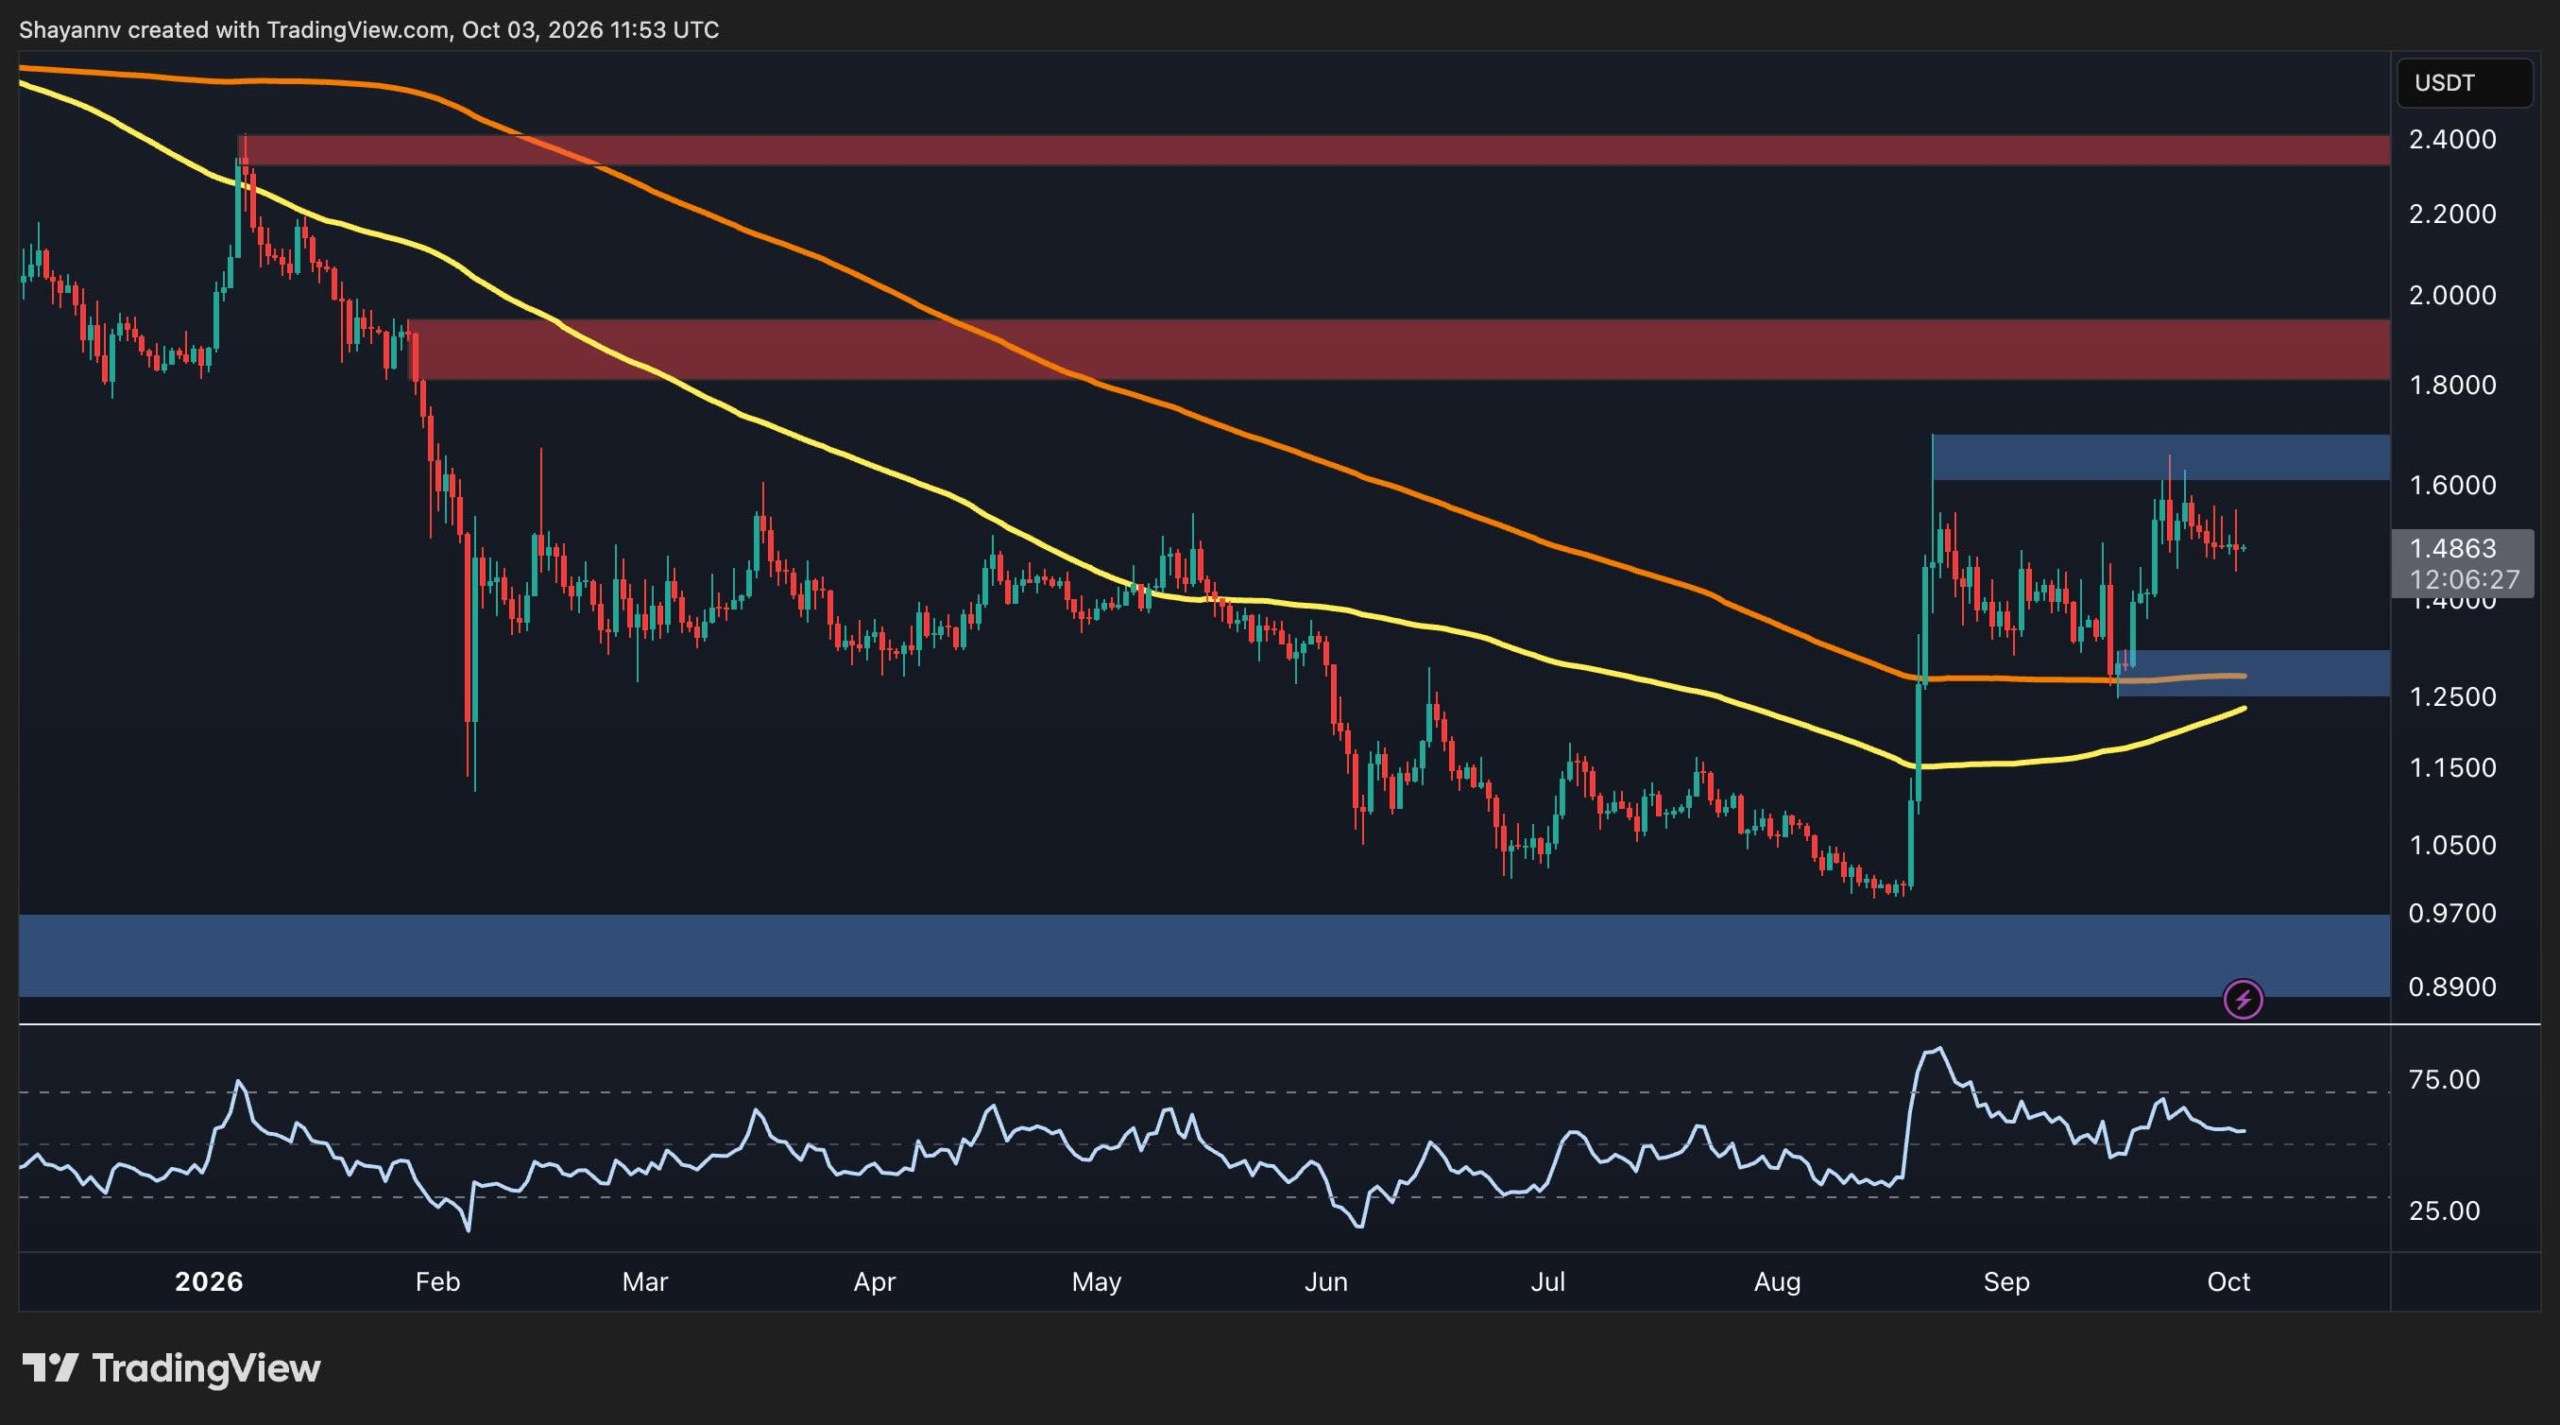
XRP is currently consolidating following a sharp recovery from the $1.00 area, holding well above major daily chart support zones. While the broader structure has improved, the 4-hour chart indicates that the asset remains beneath a descending trendline and is capped by resistance between $1.60 and $1.70.
Daily Timeframe Structure
On the daily timeframe, XRP established a significant rebound from the $1.00 support zone. This rally pushed the price back above both the 100-day and 200-day moving averages, which have begun to flatten and turn higher around the $1.30 level. Trading around $1.49, XRP relies on nearest support at approximately $1.30, a zone that aligns with a recent breakout area and the daily moving averages.
On the upside, the primary resistance is located at the $1.60 to $1.70 zone. A sustained move through this region could open the path toward resistance between $1.80 and $2.00, followed by a supply zone around $2.40. Additionally, the daily Relative Strength Index (RSI) has cooled from overbought readings and now sits in the middle of its range, indicating normalized momentum.
Shorter-Term Outlook on the 4-Hour Chart
The 4-hour chart reveals a more cautious environment. After rallying toward the $1.60 to $1.70 resistance level, XRP formed a series of lower highs beneath a descending trendline. Immediate short-term support sits near $1.45, marked by a horizontal zone where the asset has repeatedly consolidated. A decisive loss of this $1.45 support level could expose the broader $1.20 to $1.30 demand zone.
Conversely, a breakout above the descending trendline would challenge the current corrective structure, requiring XRP to reclaim the $1.60 to $1.70 resistance zone to confirm a continuation of the recovery.