The S&P 500 entered its seasonal strength period on Wednesday, October 14, marking what has historically been the index's most favorable stretch of the year. From mid-October through year-end, the index has risen in 80% of years since 1950.
Analysis from BeInCrypto shows that from the October 13 close through year-end, the S&P 500 gained in 61 of 76 years studied. The median gain during this period was 4.2%, compared to approximately 2% for an average 60-day stretch, which rises only 66% of the time.
Early Headwinds
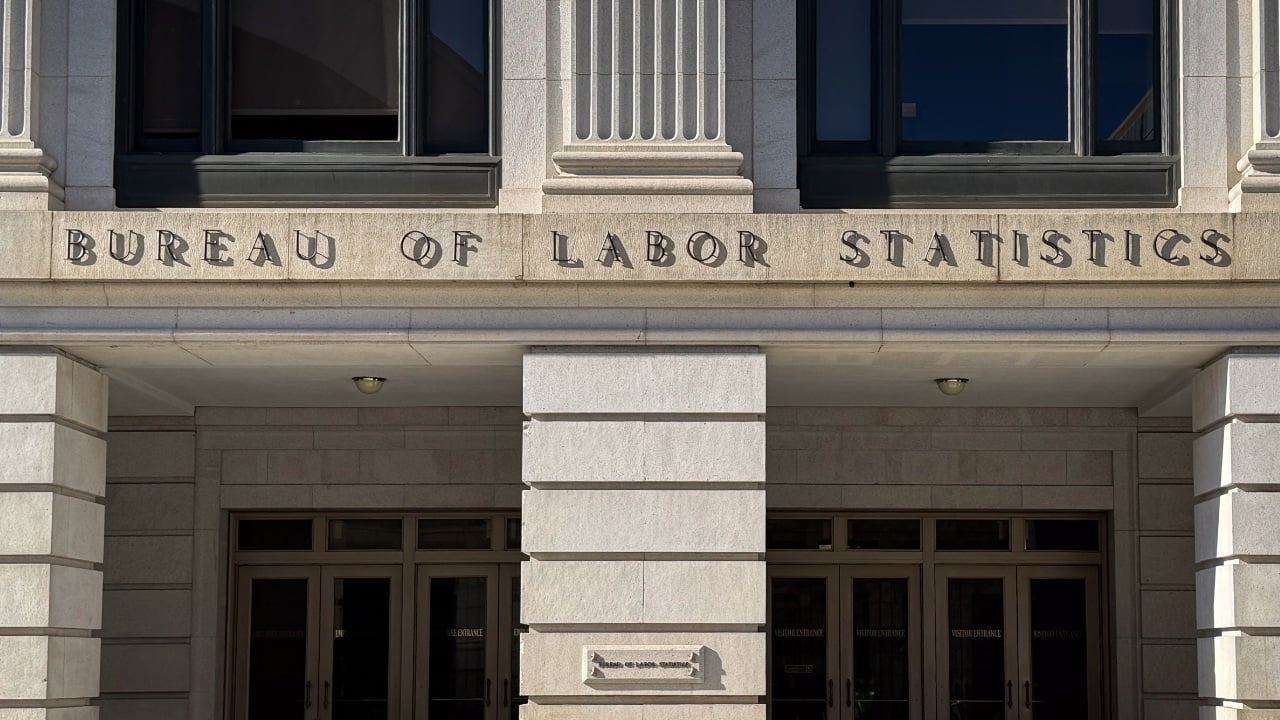
The pattern faced immediate pressure on its first day. The S&P 500 fell 0.75% on Wednesday despite recently hitting record highs, as hotter-than-expected inflation data weighed on the market. September inflation rose 3.7% year-on-year, exceeding forecasts, with gasoline prices jumping 9.1% in a single month, according to the Bureau of Labor Statistics.
November Strength, December Weakness
Historical data shows gains cluster primarily in one month. November rose in 13 of the last 14 years, while December averaged only 0.10% based on available forecaster data. This concentration of strength in late autumn is a key feature of the seasonal pattern.
Earnings and Fed Action as Deciding Factors
When the S&P 500 entered the October-to-December window up 10% to 20% from year-start, it finished the year higher in 21 of 25 cases, suggesting strong early-year performance increases the odds of seasonal gains. FactSet data shows expected third-quarter earnings growth of 29.2%, providing a fundamental foundation for the seasonal pattern.
However, risks loom. The Federal Reserve raised rates in September, and a second rate hike before year-end remains a possibility. In 2018, a midterm year that included Fed hikes, the seasonal window fell 9.4%. Whether corporate earnings can outpace the current 5% Treasury yield will likely determine whether 2024 follows the 80% historical pattern.