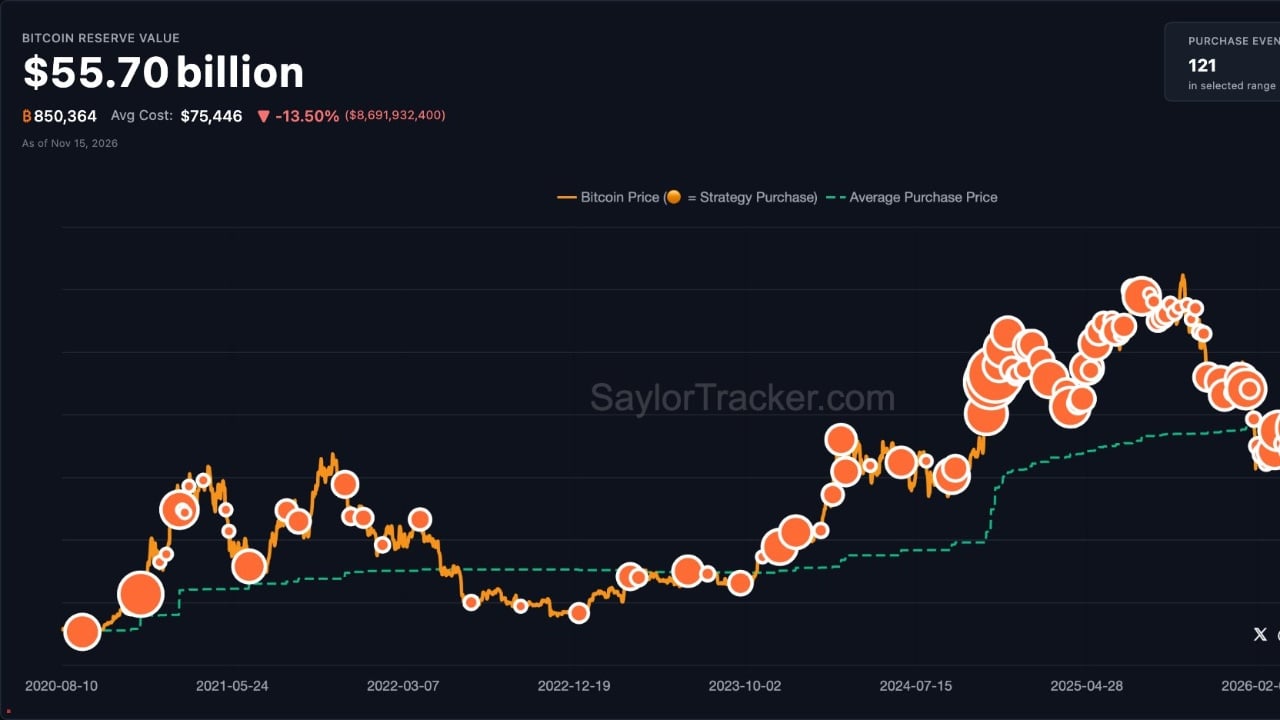
Strategy Executive Chairman Michael Saylor highlighted four Bitcoin metrics as a starting point for understanding the recent price drop. The readings cover Bitcoin's position relative to a long-term moving average, market sentiment, exchange-traded fund flows, and the asset's share of total crypto market value.
Saylor did not spell out how the readings connect to the price move. His post framed the metrics as part of a data-first approach to following Bitcoin.
Valuation and sentiment
Bitcoin trades 4.4% below its 200-week moving average, a rare position for the asset. The 200-week moving average smooths about four years of Bitcoin price history, and Bitcoin has traded above it 94.4% of the time, according to the dashboard.
The Fear and Greed Index, a 0 to 100 sentiment gauge, reads 10, signaling extreme fear. The 200-week line is not new territory this cycle: it absorbed the July selloff and preceded an August rally, according to earlier BeInCrypto price analysis.
ETF flows and market dominance
Bitcoin ETFs shed $2.92 billion over 30 days, according to the dashboard. About $1.67 billion of that left in the last seven days, meaning roughly 57% of the monthly outflow arrived in one week.
Bitcoin's dominance, its share of total crypto market value, stands at 66.9%.
What the metrics do and do not show
Saylor framed the dashboard as a way to bring key data into focus. “When you want to understand what’s happening with Bitcoin, start with the data. Strategy’s Bitcoin dashboard brings the key metrics into focus,” he said.
Binance co-founder Changpeng Zhao offered six possible explanations for the slide, from inflation data to the Anthropic IPO, while cautioning that the reasons are not certain. “Why are crypto prices down? No one knows for sure. Correlation does not prove causation,” he said.
Strategy itself faces removal from MSCI’s USA index on November 30, pressure that sits outside the four metrics Saylor highlighted. Persistent outflows would weaken the case that the 200-week line marks a floor, while a reversal in flows would strengthen it. That outcome carries weight beyond Strategy, since ETF flows and corporate treasury buying are among the market’s main demand channels.