 Loses Key Support: Road to Regaining Momentum")
The Shiba Inu (SHIB) price closed below a crucial horizontal support level at $0.0000080. This is a sign that the trend is turning bearish.
Unless Shiba Inu reclaims this level, the trend is considered bearish, and new lows are expected.
Shiba Inu Price Breaks Down Below Critical Support
The weekly timeframe technical analysis shows that the SHIB price bounced on June 10 (green icon) and created a long lower wick. The wick is considered a sign of buying pressure. Shiba Inu has increased since. The upward movement took it to a high of $0.00001135 in August.
However, the price was rejected by a descending resistance line afterward (red icon) and has fallen since. Last week, it crashed below the $0.0000080 horizontal support area.
Due to the previous increase, it initially seemed that the SHIB price had reclaimed this support area. However, last week’s fall suggests that this was not the case. Now, the $0.0000080 area is expected to provide resistance once more.
Crypto investing, simplified. Get SHIB price predictions here.
If the downward movement continues, the closest support area will be at $0.0000060. This is 20% below the current price. On the other hand, if SHIB reclaims the $0.0000080 area and breaks out, the next resistance will be at $0.0000150, 100% above the current price.
The weekly RSI is bearish. The RSI is a momentum indicator employed by traders to assess if a market is overbought or oversold, aiding them in deciding whether to accumulate or sell an asset.
Readings above 50 and an upward trend suggest that bulls still have an advantage, while readings below 50 indicate the opposite.
The RSI was rejected by the 50 line (red circle) at the same time the price was rejected by the resistance line. Now, the indicator is below 50. Both of these are considered signs of a bearish trend, suggesting that the Shiba Inu price prediction is also bearish.
Despite this setback, Shibarium wallets reached 1 million on September 4.
Your crypto compass is here. Navigate with us.
Is SHIB Price Breakdown a Sign of Things to Come?
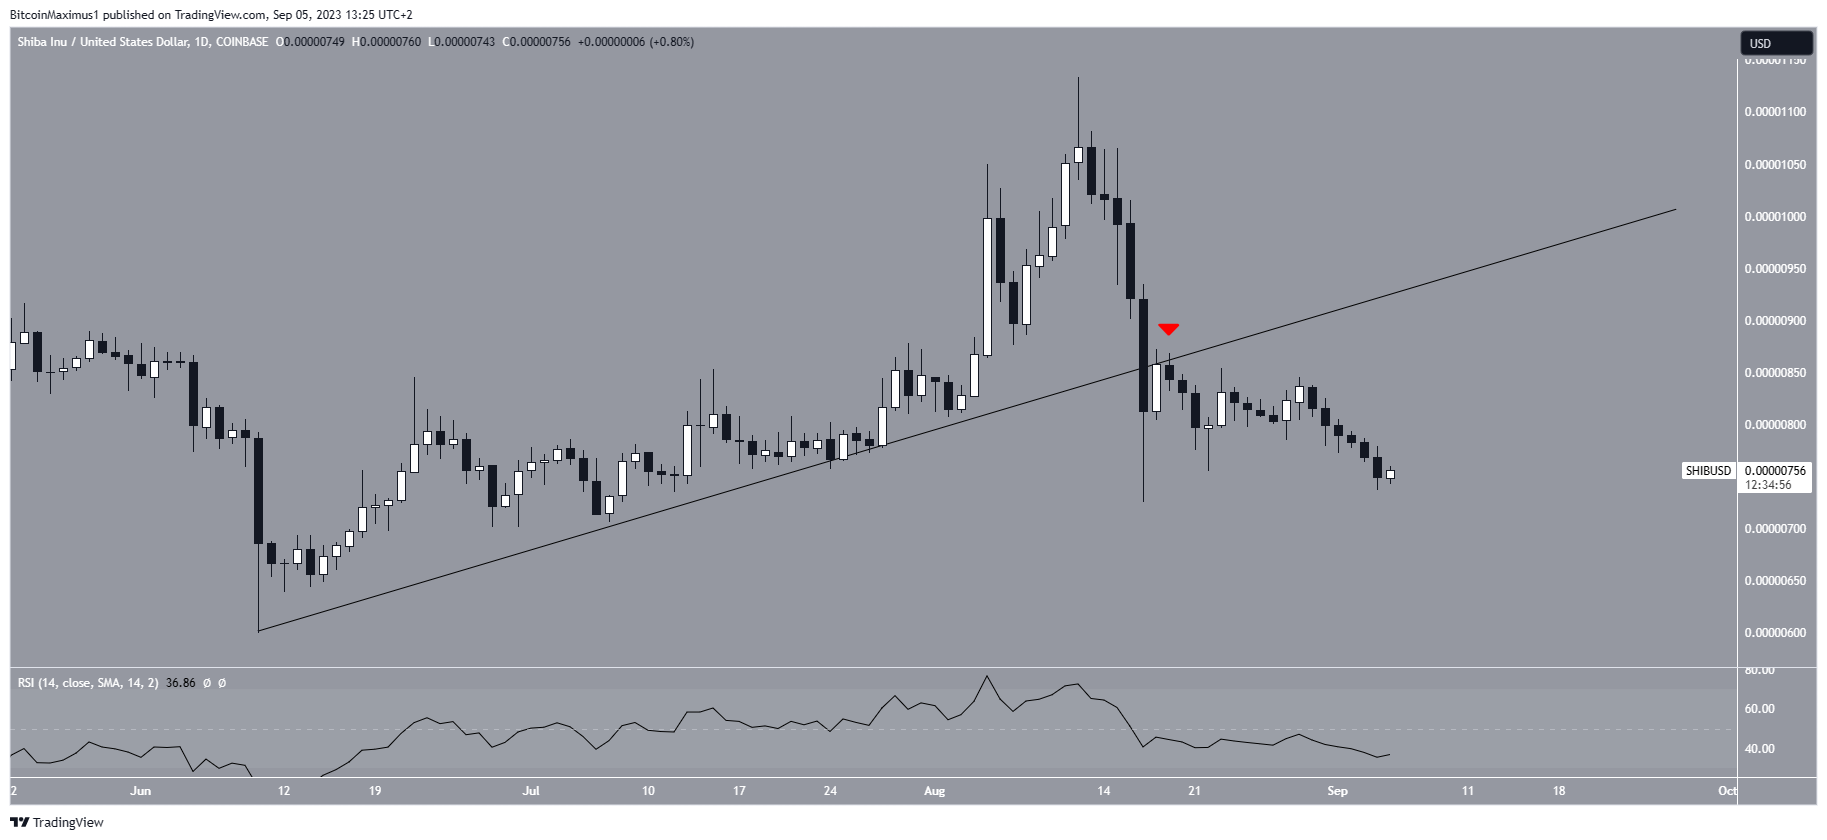
The daily timeframe data also shows signs of a bearish trend. This is mainly visible in the Shiba Inu price breakdown from an ascending support line that had been in place since the aforementioned June low.
The SHIB price broke down from the line on August 17 and was validated as resistance the next day (red icon). The SHIB price has fallen since and created several lower highs.
Additionally, the daily RSI provides a bearish reading. The indicator is falling and is below 50. Moreover, it has not generated any bullish divergence.
As a result of these bearish readings, the most likely future SHIB price prediction forecasts a fall to the aforementioned long-term support at $0.0000060.
Despite this bearish Shiba Inu price prediction, reclaiming the $0.0000080 level will mean that the trend is still bullish, and the breakdown is invalid. In that case, the SHIB price can increase to the descending resistance line at $0.000010. This would be an increase of 32%, measuring from the current price.
Check Out the 9 Best AI Crypto Trading Bots to Maximize Your Profits
For BeInCrypto’s latest crypto market analysis, click here.
The post Shiba Inu (SHIB) Loses Key Support: Road to Regaining Momentum appeared first on BeInCrypto.