 Price: Can the ‘Doge Killer’ Breach This Key Resistance?")
SHIB price has impressively surged this month by 231%, closely approaching a critical threshold. Recently, large investors have begun to gather more SHIB again, potentially fueling its upward momentum.
For a detailed exploration of these developments and their potential impact on SHIB’s trajectory, click here to read the full analysis.
Whales Are Accumulating Again
Between February 25 and March 4, there was a notable decrease in the number of addresses holding between 1,000,000 and 10,000,000 SHIB, dropping from 548,000 to 539,000. This reduction coincided precisely with a significant price increase, where SHIB’s price surged from $0.00001 to $0.000043. This represented a 330% growth within the same timeframe.
The movements of these large-scale holders, often called whales, are crucial indicators of market sentiment and potential future price movements. Their decisions to sell or buy substantial amounts of an asset can significantly influence its price.
In this context, the initial reduction in whale holders aligns with taking profits during a price rise. This can lead to price stabilization or even a correction if enough whales decide to sell simultaneously.
Following this period, from March 4 to March 12, the demographic of holders within this range slightly rebounded from 539,000 to 543,000. This pattern suggests that after capitalizing on their profits, a segment of SHIB whales regained the asset.
The subsequent accumulation phase indicates that these whales might be positioning themselves in anticipation of another upward trend, interpreting the recent price consolidation as a buying opportunity before a potential new bull run. Such strategies by whales can create momentum in the market, attracting other investors and potentially leading to further price increases.
Read More: 6 Best Platforms To Buy Shiba Inu (SHIB) in 2024
Shiba Inu MVRV Went Crazy And Then Fell Down
During the last bull run, the SHIB MVRV Ratio went from -1.51% to 71% in just four days.
The Market Value to Realized Value (MVRV) ratio is a valuation metric that compares the market capitalization of a cryptocurrency to its realized capitalization. In essence, the MVRV ratio aims to identify whether a cryptocurrency’s price is fair or over/undervalued by comparing the current market price to the average price at which each unit last moved.
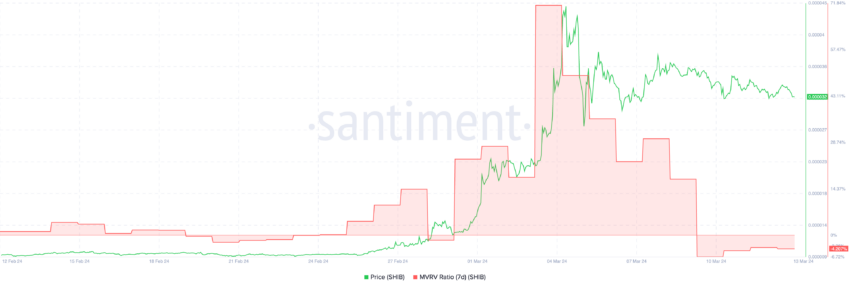
A high MVRV ratio implies overvaluation, prompting investors to take profits. A low MVRV ratio signals undervaluation, marking the asset as a potential buy for price gains.
For SHIB, when the price started to consolidate, it fell heavily per day in a row. From March 4 to March 12, its MVRV Ratio went from 71% to -4.2%. This can indicate that, after the consolidation, holders are not at a loss and could keep holding their SHIB, expecting that it will enter a new bull run again soon.
EMA Chart Draws a Neutral Scenario
When analyzing the SHIB 4-hour chart, it becomes apparent that the Exponential Moving Averages (EMAs) suggest a state of market consolidation. Specifically, the 20-EMA is observed to be in close proximity to both the price and the 50-EMA. This alignment indicates that SHIB’s price is currently moving sideways, reflecting a period of market indecision where neither buyers nor sellers have definitive control.
EMAs serve as dynamic support and resistance levels on the chart. A bounce off an EMA can indicate it is acting as support, while difficulty surpassing an EMA may suggest it is acting as resistance. Traders often use these signals and EMA crossovers to gauge potential entry or exit points.
A short-term EMA crossing above a longer-term EMA (a “golden cross”) can be seen as a bullish sign, whereas the opposite crossing (a “death cross”) might signal bearish conditions.
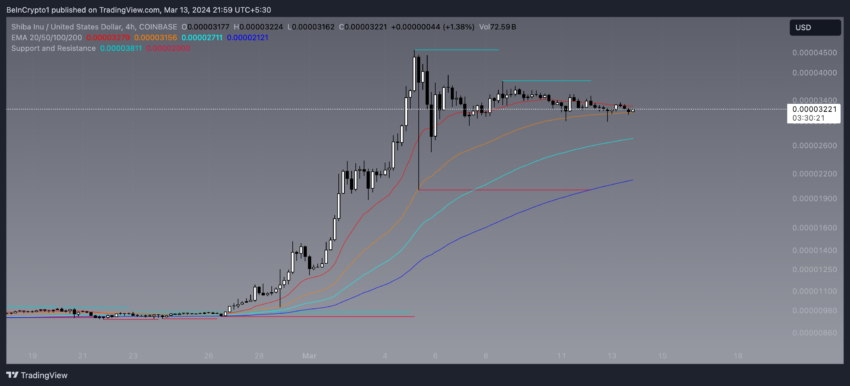
Further analysis reveals that the 100-EMA and 200-EMA are positioned well below the current price and shorter-term EMAs. This positioning signals that the trend has been bullish over the longer period assessed by these EMAs. While this does not completely negate the possibility of a significant correction, it suggests that the longer-term momentum has been positive until now, and any immediate downturns might find some support or buffer at these lower EMA levels.
Read More: Dogecoin (DOGE) vs Shiba Inu (SHIB): What’s the Difference?
If SHIB can break the $0.000035 resistance, it could continue rising and breaking new resistances at $0.000040 and $0.000045.
However, if the movement of whales and the MVRV ratio are insufficient for the $0.000030 support resist, SHIB could fall to $0.000020.
The post Shiba Inu (SHIB) Price: Can the ‘Doge Killer’ Breach This Key Resistance? appeared first on BeInCrypto.