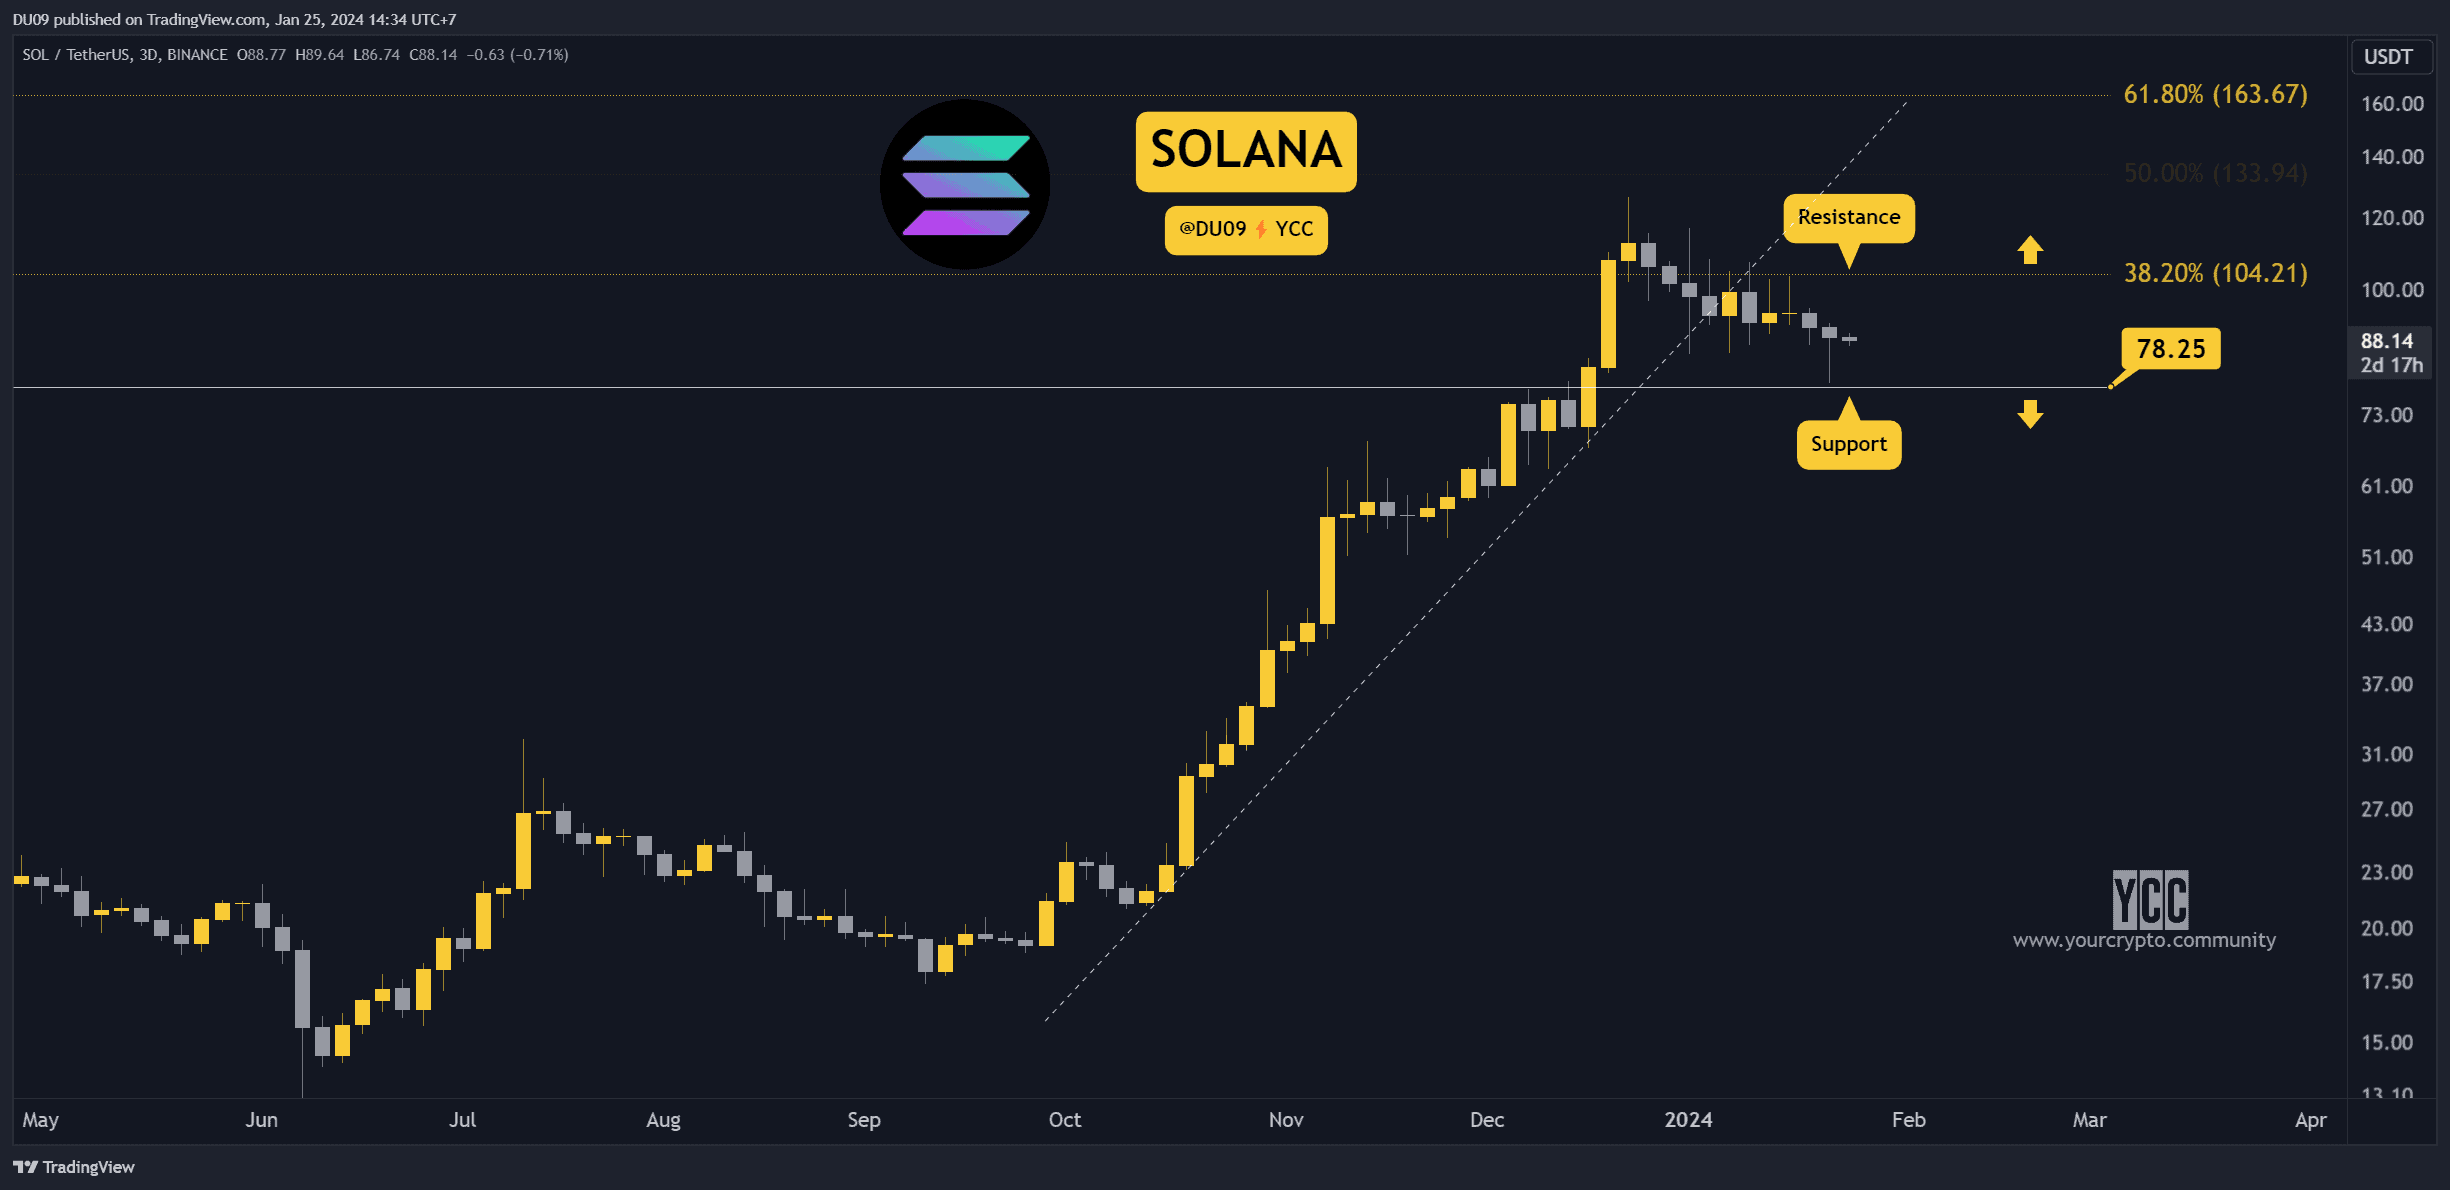
Solana found good support and may attempt a reversal next.
Key Support levels: $78
Key Resistance levels: $104
1. Sellers Hold Strong
SOL’s price briefly fell under $80 and quickly recovered from the key support. Now, buyers appear determined to continue this push. If they succeed, it could put a stop to this corrective move that started in late December.
2. Early Bullish Signals Appear
The buy volume increased in the past two days, which also explains the recent price action and bounce. If this continues, then the bulls might have a good chance to challenge the bears and take back control.

3. MACD Bullish Histogram
While SOL’s price made a lower low, the MACD histogram on the daily timeframe is making higher lows, which confirms a bullish divergence. This could be an early sign that sellers have become exhausted, and buyers could return.

Bias
The bias for SOL is neutral.
Short-Term Prediction for SOL Price
As long as the key support at $78 holds, Solana has a good chance of reversing this downtrend and attempting to recover some of the most recent losses.
Binance Free $100 (Exclusive): Use this link to register and receive $100 free and 10% off fees on Binance Futures first month (terms).
Disclaimer: Information found on CryptoPotato is those of writers quoted. It does not represent the opinions of CryptoPotato on whether to buy, sell, or hold any investments. You are advised to conduct your own research before making any investment decisions. Use provided information at your own risk. See Disclaimer for more information.
Cryptocurrency charts by TradingView.