 Bulls Charge: Is a New All-Time High Price Next?")
The Solana (SOL) price appears poised to initiate a new bullish cycle, mirroring Bitcoin’s recent trajectory.
This raises the question: will Solana soon reach a new all-time high (ATH)?
Can Solana Break the Golden Ratio Resistance at $170?
Solana is nearing the golden ratio resistance at approximately $170, with only about a 10.6% gap to bridge. A breakthrough at this crucial level could begin a new bullish cycle for Solana, potentially leading it to retest its all-time high (ATH) of around $260.
Additionally, the Moving Average Convergence Divergence (MACD) histogram indicates an upward trend on the monthly chart, with the MACD lines in a bullish cross and the Relative Strength Index (RSI) in overbought territory. Notably, there are no signs of bearish divergence or other bearish signals at this time.
Solana Weekly Chart: Strong Bullish Momentum Continues
In the weekly chart, Solana shows predominantly bullish signals. The MACD histogram has been trending higher since the previous week, with the MACD lines crossing bullishly. However, the RSI is overbought territory, potentially signaling a bearish divergence.
Read more: Solana (SOL) Price Prediction 2024 / 2025 / 2030
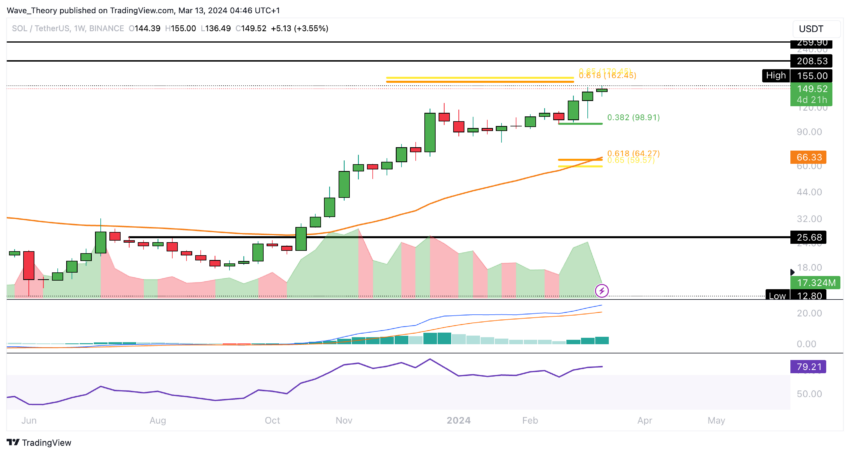
If Solana faces bearish rejection at the golden ratio level around $170, it may find support at approximately $99 and $60, with the 50-week Exponential Moving Average (EMA) providing additional support at around $66.3.
Solana Daily Chart: MACD Showing Bearish Signal
In the daily chart, Solana displays some bearish signals alongside bullish ones. Although the MACD lines remain crossed bullishly, the MACD histogram has been trending lower in a bearish manner.
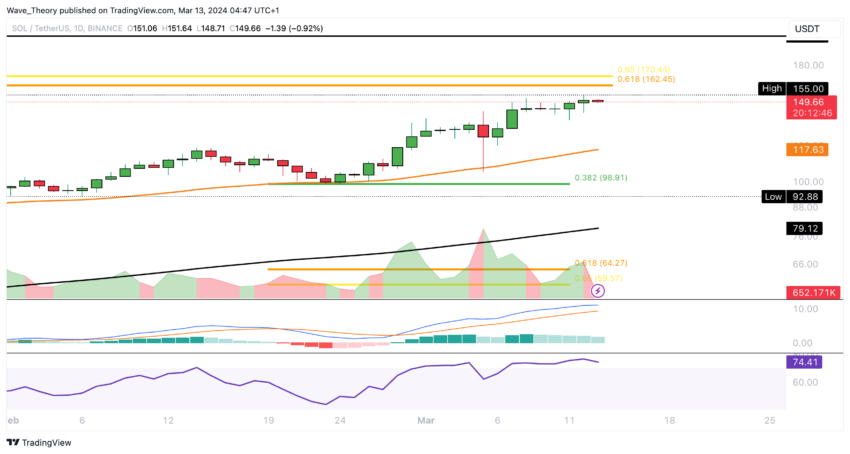
Additionally, the RSI is in overbought territory. However, the golden crossover of the EMA suggests a bullish trend in the short to medium term.
Solana 4H Chart: Mixed Signals from Indicators
In Solana’s 4-hour chart, the indicators present a mixed picture. While the MACD histogram trends lower and the MACD lines are crossed bearishly, the RSI remains neutral.
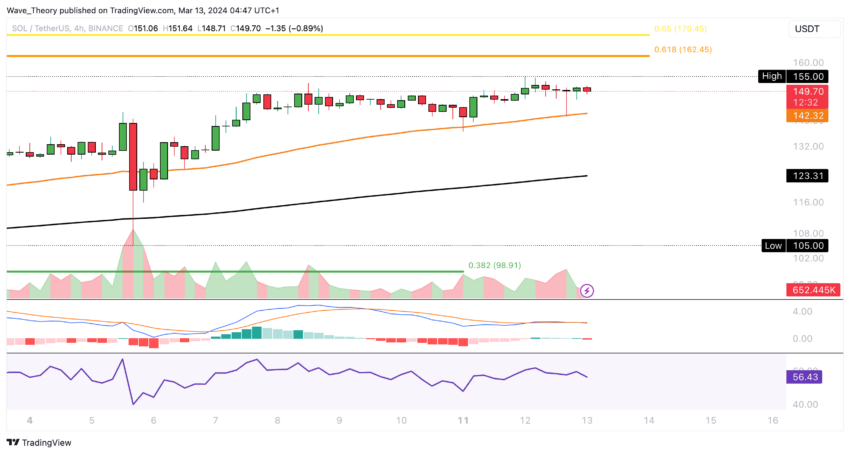
However, the golden crossover of the EMAs suggests a short-term bullish trend.
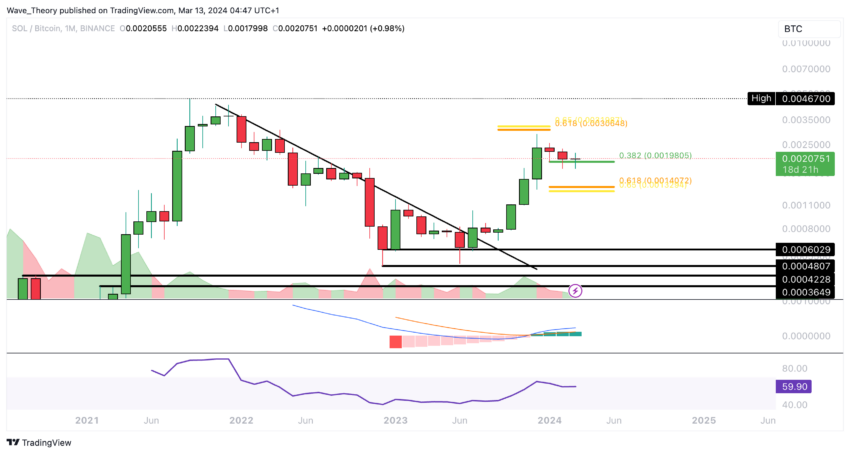
Solana Finds Strong Support Against Bitcoin at 0.382 Fib Level
Against BTC, Solana’s price continues to find significant Fibonacci support at around 0.00198 BTC, which has been successful thus far. If Solana bounces bullishly from this level, it could target the golden ratio at around 0.003 BTC.
Read More: How to Buy Solana (SOL) and Everything You Need To Know
Otherwise, the next significant support lies at around 0.0014 BTC. In the monthly chart, indicators remain bullish, with the MACD histogram trending upwards, MACD lines bullishly crossed, and the RSI in neutral territory.
The post Solana (SOL) Bulls Charge: Is a New All-Time High Price Next? appeared first on BeInCrypto.