Disclaimer: The opinions expressed by our writers are their own and do not represent the views of U.Today. The financial and market information provided on U.Today is intended for informational purposes only. U.Today is not liable for any financial losses incurred while trading cryptocurrencies. Conduct your own research by contacting financial experts before making any investment decisions. We believe that all content is accurate as of the date of publication, but certain offers mentioned may no longer be available.
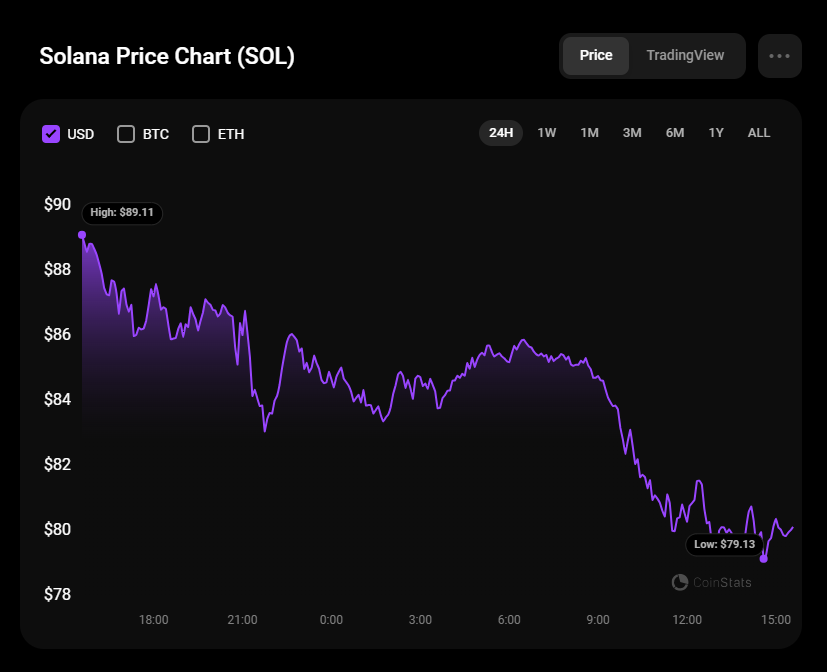
Bulls are not yet able to seize the initiative, according to CoinStats.
SOL/USD
Solana (SOL) is one of the biggest losers today, going down by more than 10%.
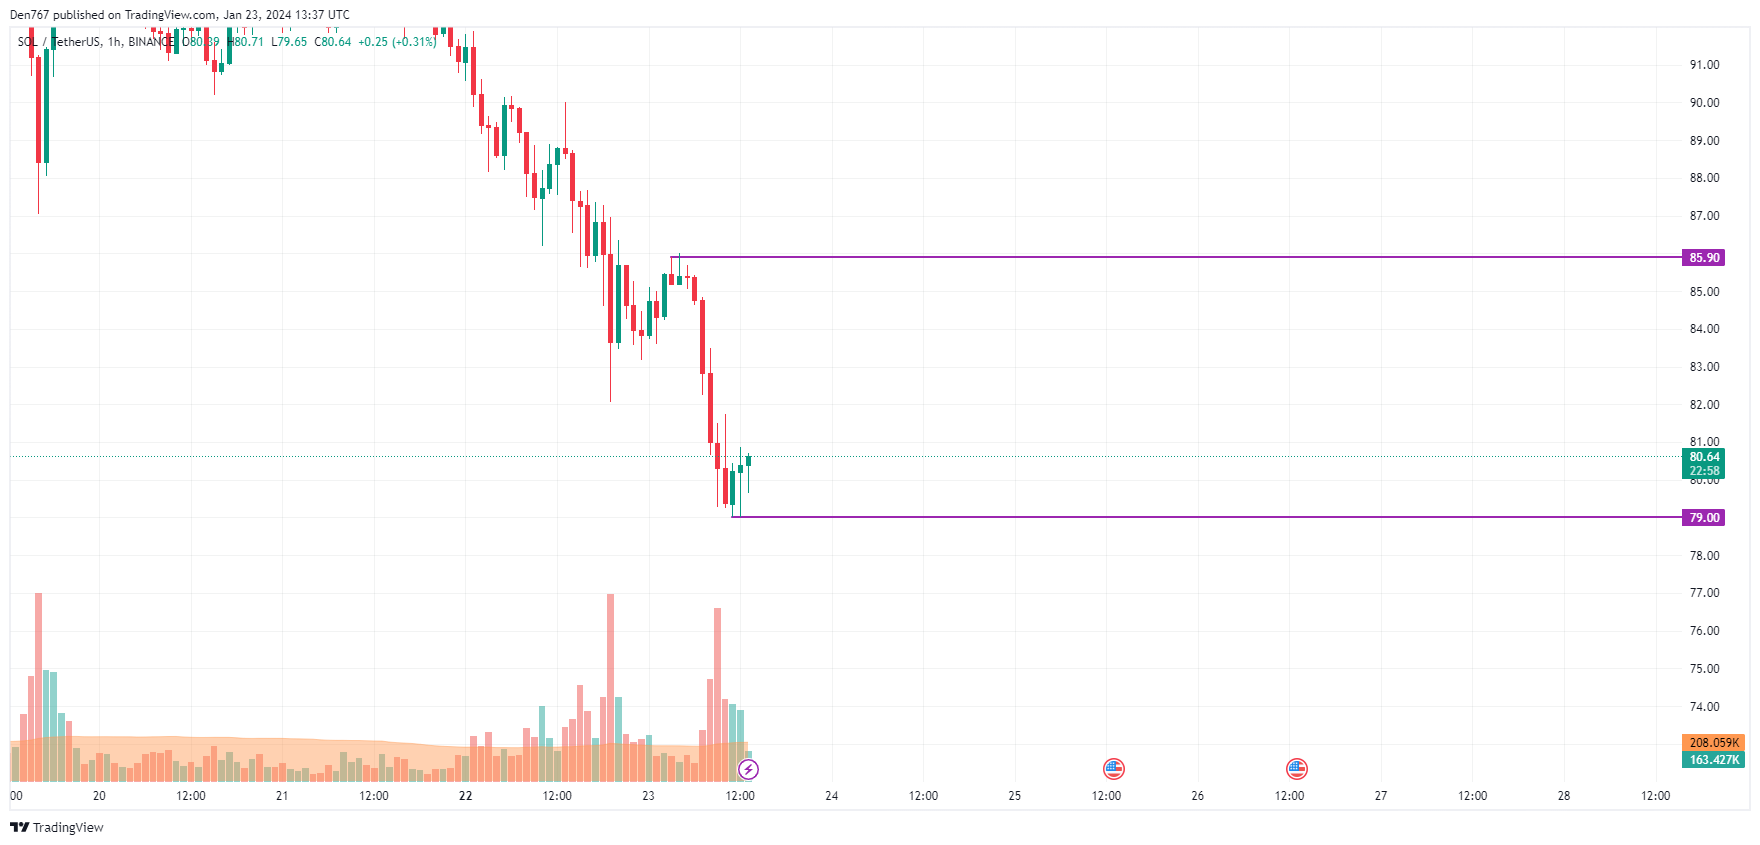
Despite today’s sharp drop, the price of SOL might have found a local support level of $79. However, one should pay attention to the bar’s closure.
Only if it happens far from that mark, buyers may locally seize the initiative, which could lead to a test of the $83-$84 area.
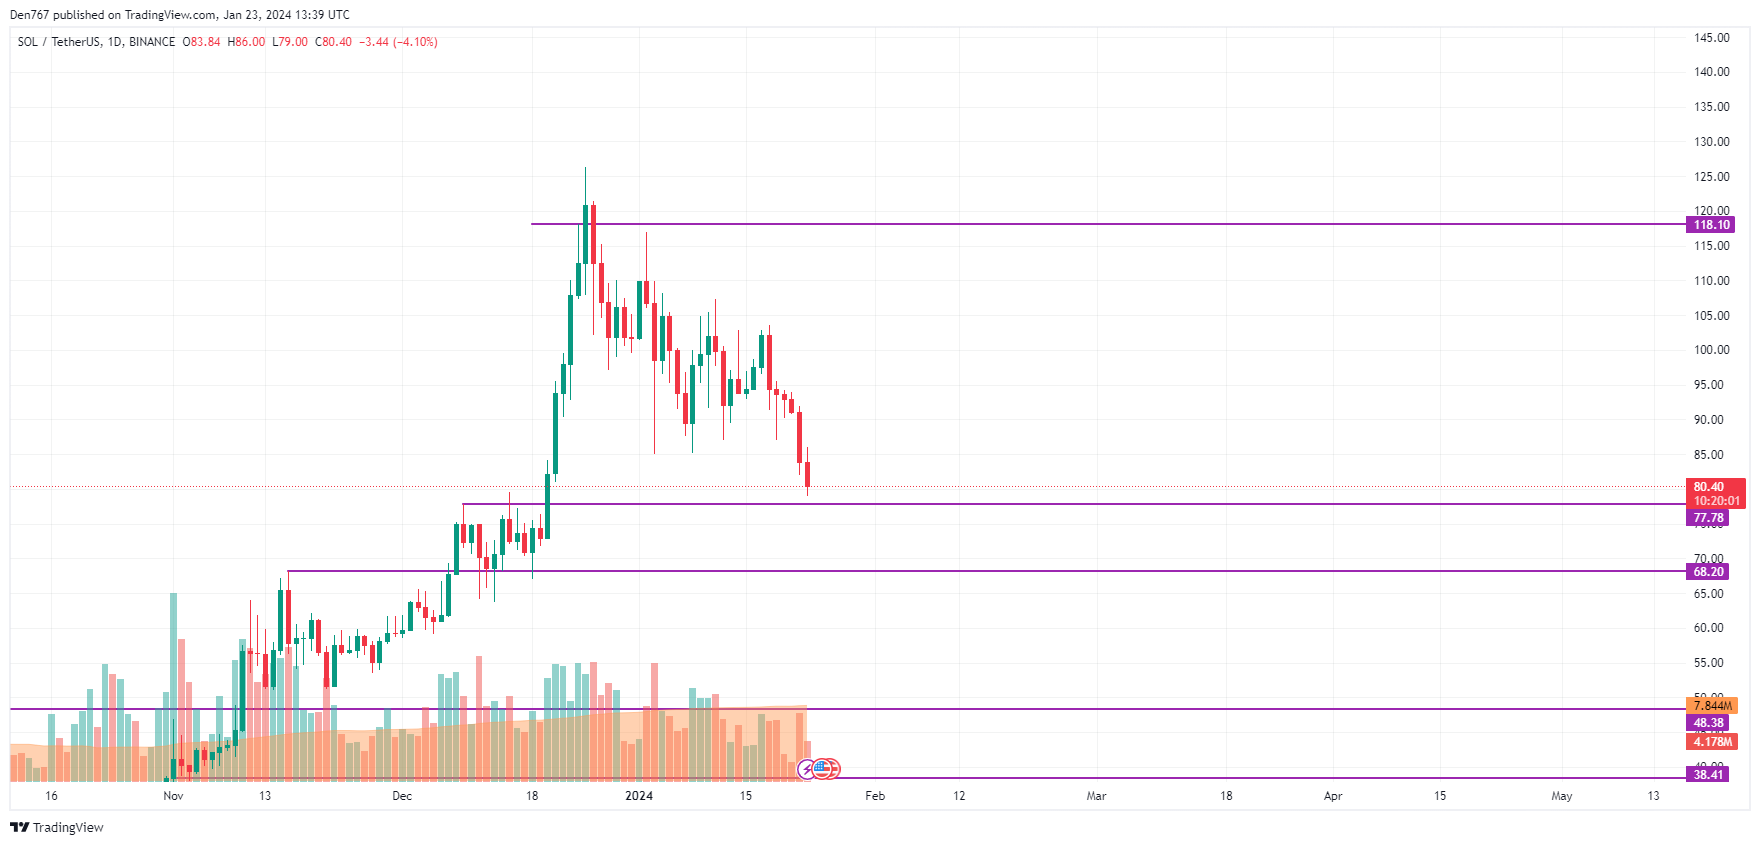
On the daily time frame, the rate of SOL is approaching the mirror level of $77.78. However, if the bar closes with no long wick, one should expect a breakout, followed by a move to the $70-$75 range. Such a scenario is relevant until the end of the week.
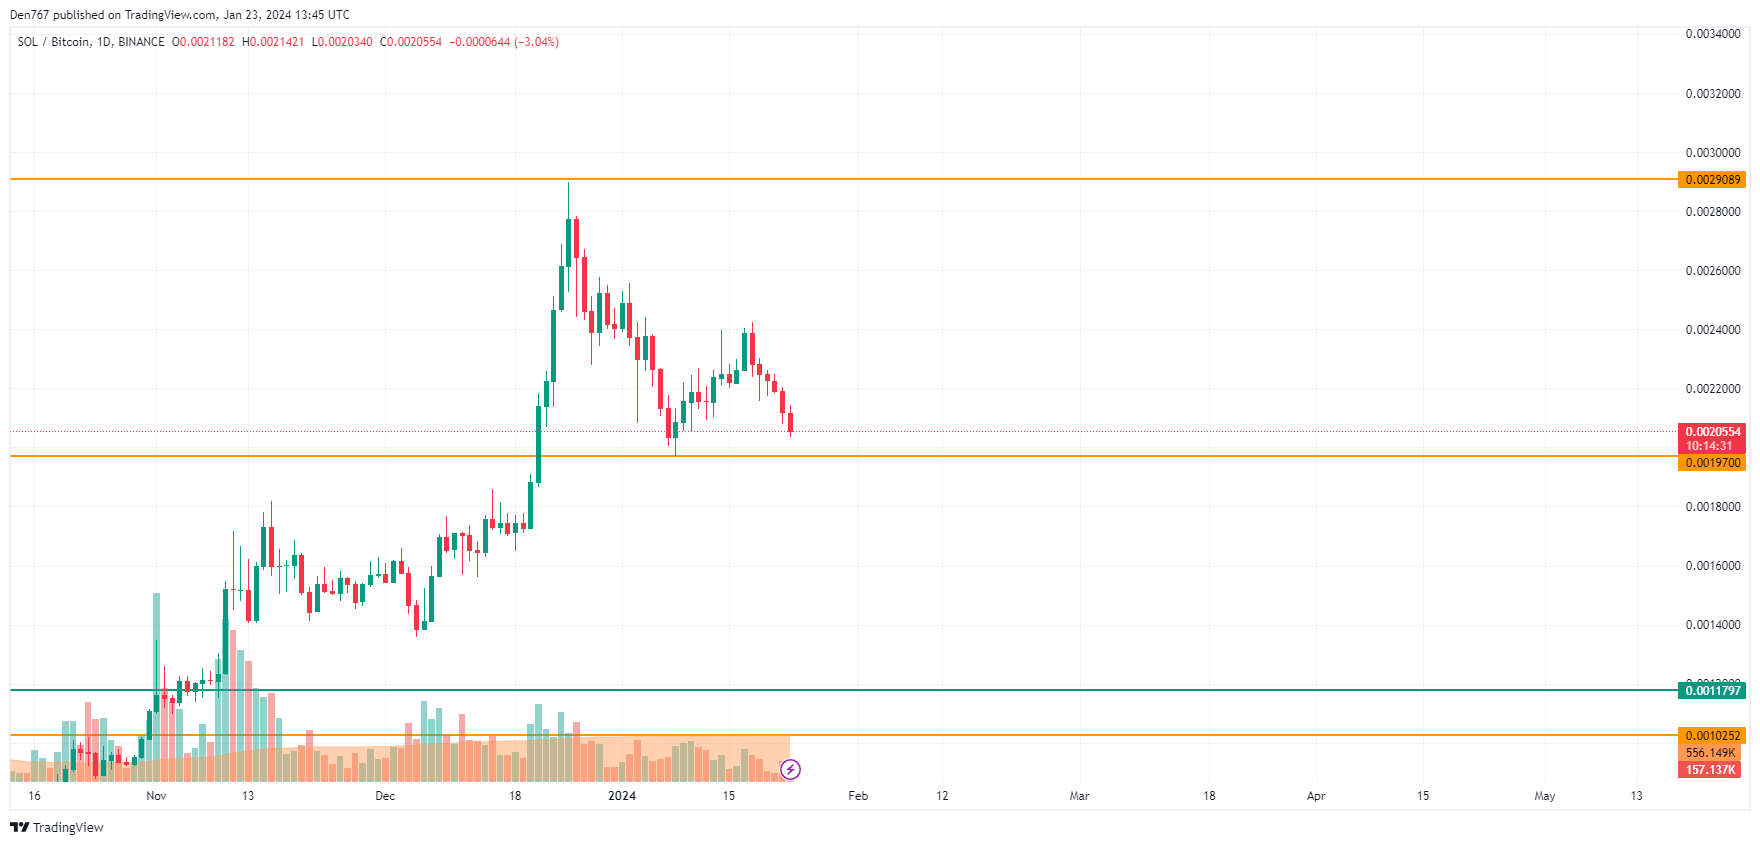
On the daily chart against BTC, SOL is on its way to testing the support of 0.001970. If its false breakout happens, there is a possibility to see a bounce back to the 0.00021 zone.
SOL is trading at $79.95 at press time.