 Price Consolidates Above 0: Is the Next Move Up or Down?")
The Solana (SOL) price is trading above the $100 level but has not yet reached its 2023 high.
Solana has traded inside a neutral pattern since the high mentioned above. Will it break out for it, or is a breakdown in store instead?
Solana Consolidates Above $100
The weekly time frame outlook for SOL shows the price has increased since falling to a low of $79 in January. It created successive bullish weekly candlesticks in the past two weeks, leading to a high of $119.
However, while SOL closed above a long-term Fib retracement resistance level of $100, it did not reach its 2023 high of $126. Rather, it created a slightly lower high.
The weekly Relative Strength Index (RSI) gives a mixed reading. The RSI is a momentum indicator traders use to evaluate whether a market is overbought or oversold and whether to accumulate or sell an asset.
Read More: How to Buy Solana (SOL)
Readings above 50 and an upward trend suggest that bulls still have an advantage, while readings below 50 indicate the opposite. While the indicator is above 50, it has also generated a bearish divergence (green) that often precedes downward movements.
SOL Price Prediction: When Will the Price Break Out?
The daily time frame analysis does not confirm the trend’s direction because of its mixed price action and wave count. The price action shows that SOL has possibly traded inside a symmetrical triangle since its December 25, 2023 high. The symmetrical triangle is considered a neutral pattern, meaning both breakouts and breakdowns are possible.
However, cryptocurrency trader Altcoin Sherpa noted the SOL price is in a decent position to enter trades.
“$SOL: Buying around $100 seems right; this is still a pretty choppy chart. I think that just buying and holding is going to be the best strategy for most people overall. #Solana“. He stated.
The wave count suggests the SOL price is consolidating in anticipation of another upward movement. Elliott Wave theory involves the analysis of recurring long-term price patterns and investor psychology to determine the direction of a trend. The most likely count suggests SOL is in wave four in a five-wave upward movement. Wave four has likely taken the shape of a symmetrical triangle.
Read More: What is Solana (SOL)?
If the count is correct, SOL will continue consolidating in the triangle before an eventual breakout. If that happens, a nearly 40% increase to the next resistance at $145 could transpire.
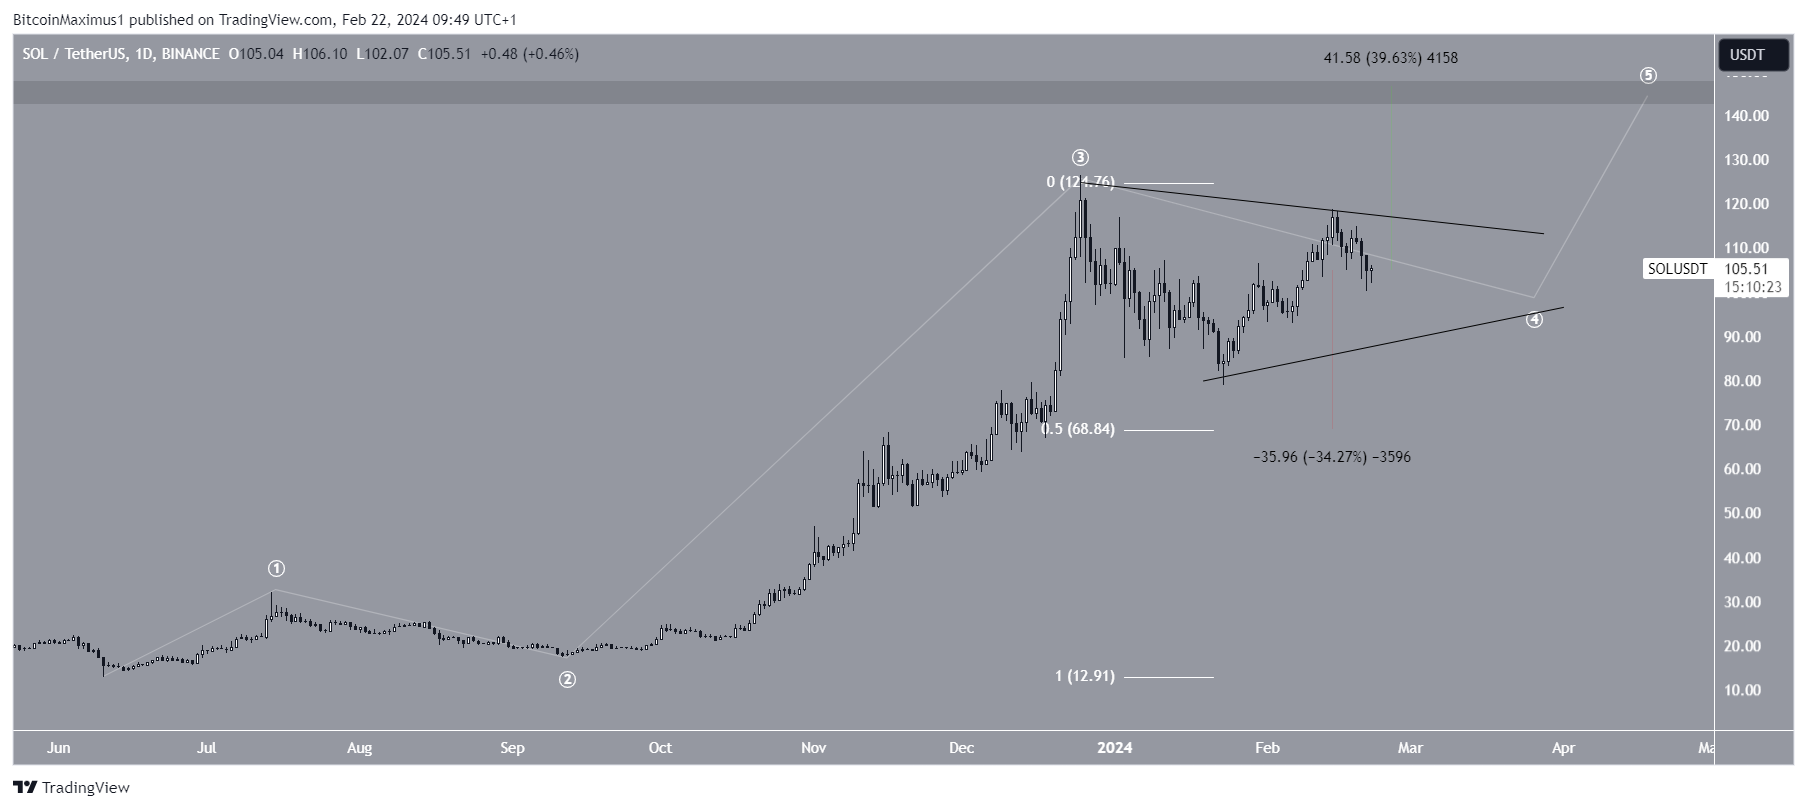
Despite the bullish SOL price prediction, a breakdown from the triangle will mean the local top is in. Then, SOL could fall 35% to the 0.5 Fib retracement support level at $69.
For BeInCrypto‘s latest crypto market analysis, click here.
![]()
Coinbase
Coinbase” target=”_blank”>Explore →
![]()
PrimeXTB
PrimeXTB ” target=”_blank”>Explore →
![]()
AlgosOne
AlgosOne” target=”_blank”>Explore →
![]()
UpHold
UpHold” target=”_blank”>Explore →
![]()
iTrustCapital
iTrustCapital” target=”_blank”> Explore →
Explore more
The post Solana (SOL) Price Consolidates Above $100: Is the Next Move Up or Down? appeared first on BeInCrypto.