 Price in Limbo: Here Are Two Scenarios for the Future Price")
The Stellar (XLM) price has fallen since its yearly high in July and is approaching a long-term horizontal support level at $0.105.
While the price has broken out from a short-term descending resistance line, it failed to sustain its upward movement.
Stellar Price Continues Descent Towards Support
The technical analysis from the weekly time frame shows that the Stellar lumens price has fallen since its yearly high of $0.195 in July 2023. The downward movement was sharp, creating a long upper wick (red icon).
This led to a low of $0.105 in August, which validated the $0.105 horizontal area as support. Interestingly, this created a long lower wick (green icon), considered a sign of buying pressure.
While the price bounced afterward, it has failed to sustain its increase and is trading only 10% above the $0.105 horizontal support area.
Predict, prepare, profit. Visit for XLM crypto forecasts.
Despite the drop, the RSI reading is still bullish. The RSI is a momentum indicator used by traders to evaluate whether a market is overbought or oversold, and to determine whether to accumulate or sell an asset. Readings above 50 and an upward trend suggest that bulls still have an advantage, while readings below 50 indicate the opposite.
The indicator moved above 50 in June (green circle) and currently validates the line as support (green icon).
If the price resumes its previous upward movement, the next resistance will be at $0.235, roughly 100% above the current price. It is worth mentioning that a court has approved the FTX liquidation plan for various crypto assets.
The bankrupt crypto exchange has not reported that it will liquidate any XLM tokens.
Read More: 11 Best Sites To Instantly Swap Crypto for the Lowest Fees
XLM Price Prediction: Unclear After Failure to Sustain Breakout
The daily timeframe analysis provides mixed readings due to both the price action and RSI.
Firstly, the XLM price broke out from a descending resistance line on September 4. This bullish sign was expected to lead to a significant price increase. However, this was not the case. The XLM price failed to reclaim the $0.130 horizontal area, instead being rejected and validating it as resistance (red icon).
The failure to sustain the breakout is considered a bearish sign and puts its validity at risk.
The RSI also gives an undetermined reading. The indicator is right at the 50 line, indicating an undetermined trend.
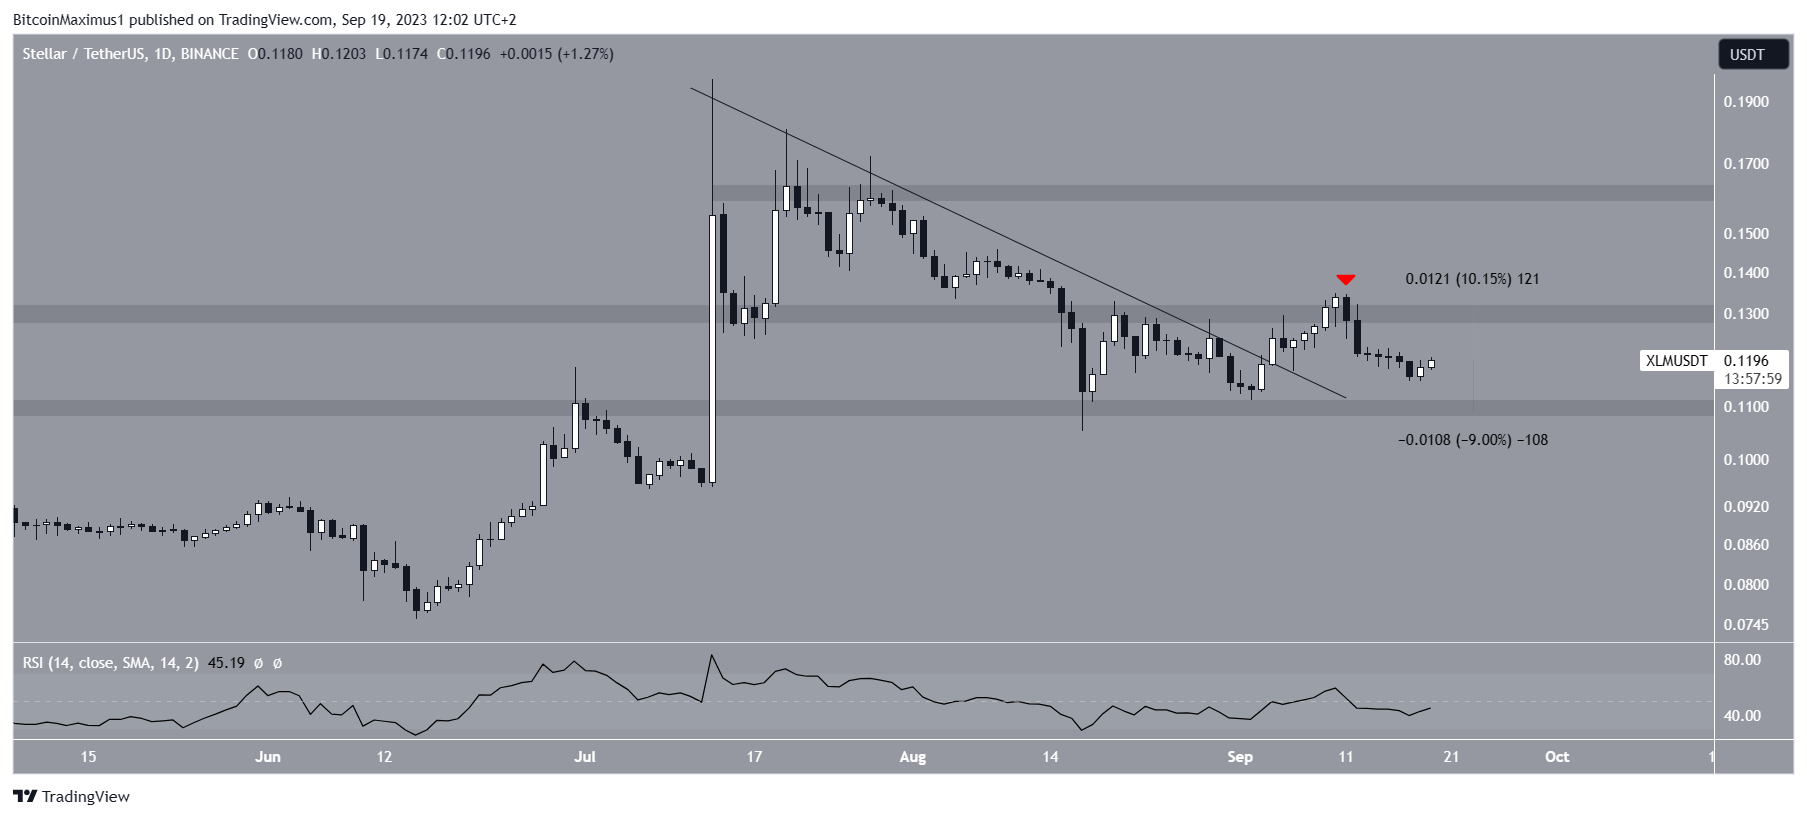
To conclude, the XLM price prediction is still undetermined. An increase to the $0.130 resistance area will amount to an upward movement of 10%, while a drop to the $0.110 area will be a decrease of 9%.
Interested in AI Trading? 9 Best AI Crypto Trading Bots to Maximize Your Profits
For BeInCrypto’s latest crypto market analysis, click here.
The post Stellar (XLM) Price in Limbo: Here Are Two Scenarios for the Future Price appeared first on BeInCrypto.