
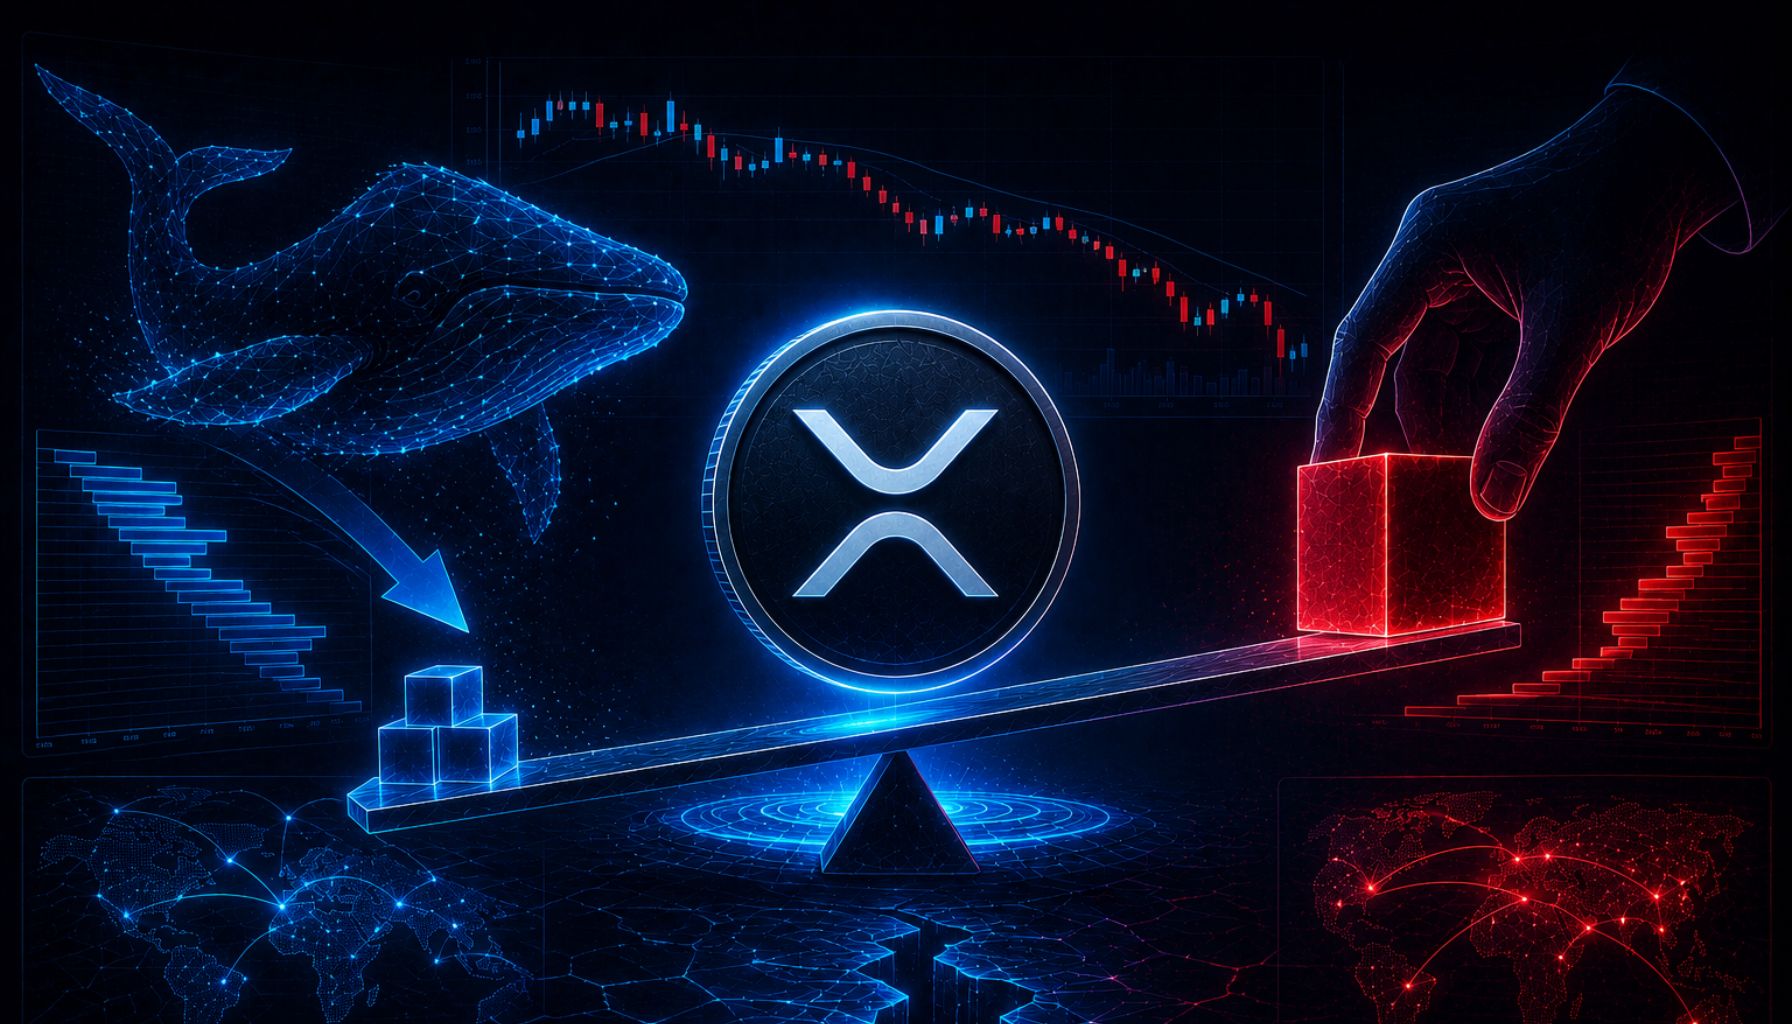
XRP is struggling below $1.40 as selling pressure keeps the price pinned in a range that has resisted every recovery attempt in recent sessions. The market is cautious and the direction is unclear — but an Arab Chain analysis tracking Binance liquidity conditions has identified a structural development that changes how the current weakness should be interpreted and what the next significant price movement might look like when it arrives.
The 30-day liquidity index for XRP on Binance has fallen to approximately 0.043 — its lowest level since January 2020. That date requires context to feel as significant as the number demands. January 2020 predates the DeFi summer, the 2021 bull market, the FTX collapse, and the entire institutional era that has since transformed crypto market structure. XRP has not been this illiquid on Binance at any point across five years of the most dramatic market cycles the asset has ever experienced.
The practical implication of a liquidity index at this level is direct and immediately relevant. Market depth — the capacity of the order book to absorb large buy or sell orders without significant price impact — has declined to a level where the normal relationship between order size and price movement no longer applies. Orders that would produce modest price changes in a liquid market produce amplified responses in a market this thin.
Arab Chain’s analysis examines what that amplification means for XRP trading near $1.34 — and the answer is more consequential than the price level alone suggests.
The Liquidity That Built XRP’s Previous Moves Has Nearly Vanished
The Arab Chain analysis places the current reading in the historical context that gives it its full weight. Between 2022 and 2024, XRP’s 30-day liquidity index on Binance registered readings above 3 and 4 points — a depth of market activity that coincided with the periods of strongest trading volume, most significant volatility, and most meaningful price discovery the asset produced during that cycle.
The order books were deep, large transactions moved through the market without disproportionate impact, and the infrastructure for sustained directional moves was present.

XRP Binance 30D Liquidity Index | Source: CryptoQuant
The collapse from those elevated readings to the current 0.043 is not a gradual normalization. It is a near-total withdrawal of the speculative participation and liquidity inflows that characterized XRP’s most active periods. The market that could absorb large orders without flinching in 2023 and 2024 has been replaced by one where the same order size produces a fundamentally different price response.
The bidirectional nature of that sensitivity is the honest framing the analysis maintains. Low liquidity does not predict direction — it predicts magnitude. A large sell order into a market this thin produces a sharper decline than it would in a deep market. A large buy order produces a sharper advance. The current 0.043 reading describes a market coiled rather than directional — one where the catalyst determines the outcome but the thin order book determines the scale of the response.
XRP near $1.34 in this liquidity environment is not simply a price level. It is a compressed structure where the next significant flow, in either direction, meets a market with almost no depth to absorb it gradually. The Arab Chain analysis identifies that condition as one of caution and anticipation — a market waiting for the catalyst that determines which way the compression resolves, and how far it travels when it does.
XRP Consolidates As Liquidity Conditions Continue To Deteriorate
XRP continues trading in a tight consolidation range below the critical $1.40 resistance zone as momentum weakens and volatility compresses across the broader structure. The daily chart shows repeated failed breakout attempts throughout May, with every rally toward the $1.45–$1.50 region being absorbed by sellers before bullish momentum could expand further.
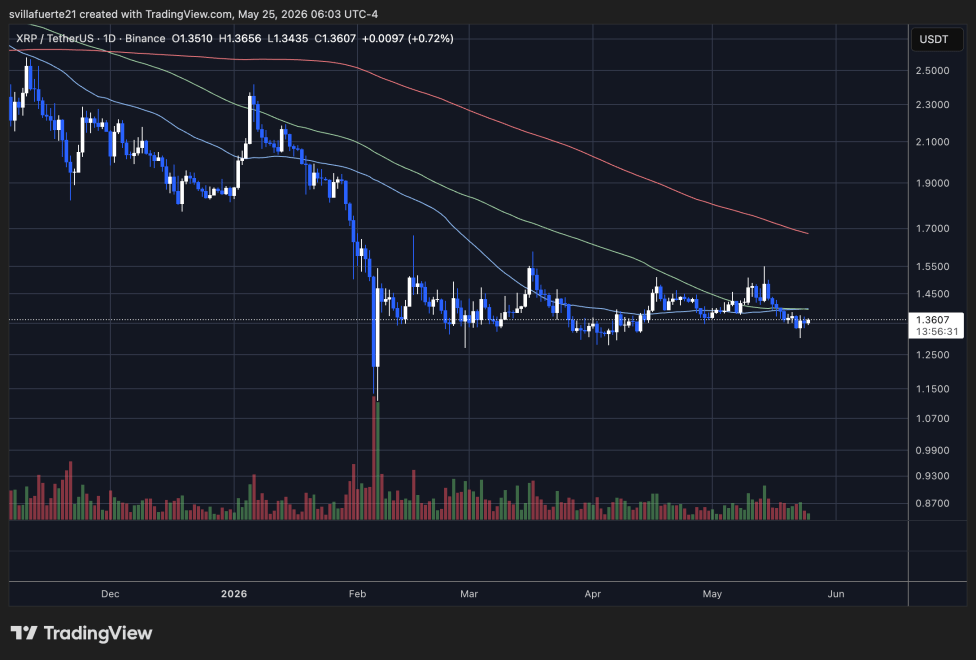
XRP consolidates around key resistance level | Source: XRPUSDT chart on TradingView
Technically, XRP is now hovering directly around the 50-day moving average, while the 100-day moving average continues acting as dynamic resistance overhead near the mid-$1.40 range. The 200-day moving average remains significantly higher and continues sloping downward, confirming that the broader macro structure still favors caution despite the recent stabilization.
What stands out most on the chart is the prolonged sideways behavior following February’s capitulation event. Since the sharp selloff that briefly pushed XRP near the $1.15 area, the price has largely remained trapped between approximately $1.30 and $1.50 without establishing a clear trend. That prolonged compression reflects a market lacking strong directional conviction from either buyers or sellers.
If XRP loses the $1.30 support region decisively, downside pressure could accelerate quickly. However, reclaiming the $1.45–$1.50 resistance zone would likely trigger renewed bullish momentum and force sidelined liquidity back into the market.
Featured image from ChatGPT, chart from TradingView.com

Editorial Process for bitcoinist is centered on delivering thoroughly researched, accurate, and unbiased content. We uphold strict sourcing standards, and each page undergoes diligent review by our team of top technology experts and seasoned editors. This process ensures the integrity, relevance, and value of our content for our readers.