The FLOKI and PEPE prices have held up well today despite an ongoing crypto market correction.
If meme coins flourish during the upcoming bullish market cycle, which one of these will lead the meme coin charge? Let’s find out!
FLOKI Leads Meme Coin Charge
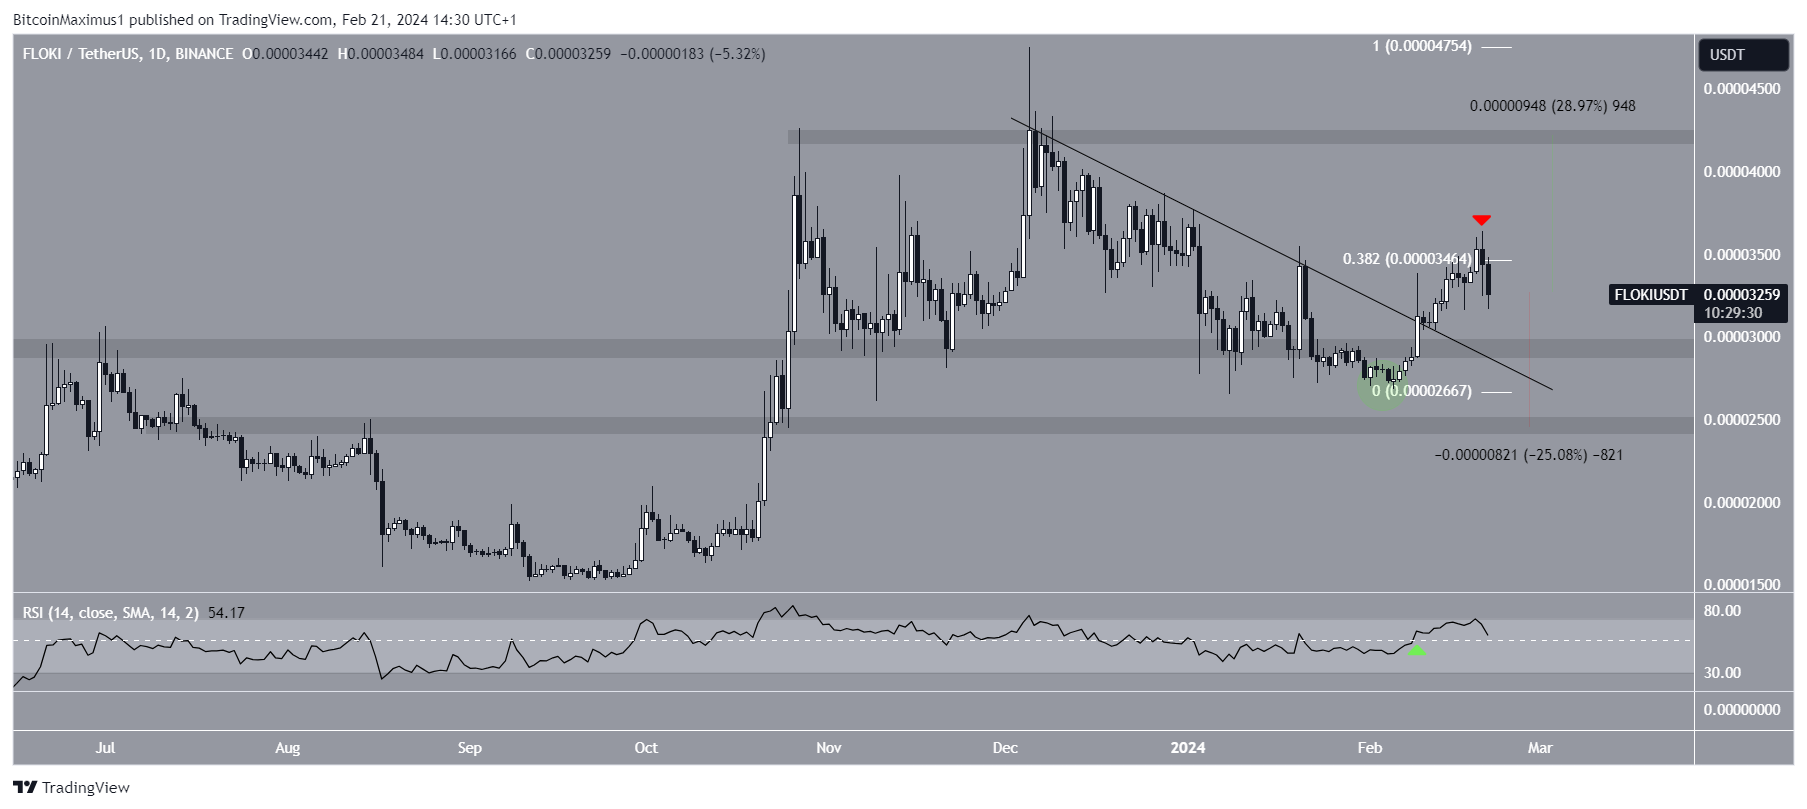
The daily time frame technical analysis shows the FLOKI price has increased since the start of February. On February 9, it broke out from a descending resistance trend line and reclaimed the $0.0000295 horizontal area. FLOKI had previously fallen below the area (green circle), but the upward movement rendered that decrease as just a deviation.
During the breakout, the daily Relative Strength Index (RSI) increase above 50 (green icon). Traders utilize the RSI as a momentum indicator to assess whether a market is overbought or oversold and whether to accumulate or sell an asset. If the RSI reading is above 50 and the trend is upward, bulls still have an advantage, but if the reading is below 50, the opposite is true. So, the RSI readings legitimize the breakout.
After breaking out, FLOKI was rejected by the 0.382 Fib retracement resistance level at $0.0.0000345 (red icon) and has fallen since. Despite this decrease, the trend is considered bullish as long as FLOKI does not close below the $0.0000295 support. If the FLOKI price resumes its previous breakout, it can increase by 30% to the next resistance at $0.0000425.
Read More: What Are Meme Coins?
Despite this bullish FLOKI price prediction, closing below $0.0000295 can trigger a 25% drop to the next closest support at $0.0000245.
PEPE Breaks Out From 70-Day Resistance
The PEPE price movement shares similarities to that of FLOKI. More specifically, the price reclaimed a horizontal support area and broke out from a descending resistance trend line on February 14. At the time of the breakout, the trend line had existed for 70 days.
Even though PEPE did not sustain its breakout, it returned to validate the resistance trend line as support today (green icon). This is a common movement after such breakouts, supported by the RSI increasing above 50.
Read More: 7 Hot Meme Coins that are Trending in 2024
Next, the wave count predicts the upward movement will continue. The most likely count shows a completed five-wave upward movement (white) and ensuing correction (black). Elliott Wave theory involves the analysis of recurring long-term price patterns and investor psychology to determine the direction of a trend.
If the count is correct, PEPE has begun another five-wave upward movement. If both increases have the same length, the PEPE price will move upwards by 75% and reach the $0.0000020 level.
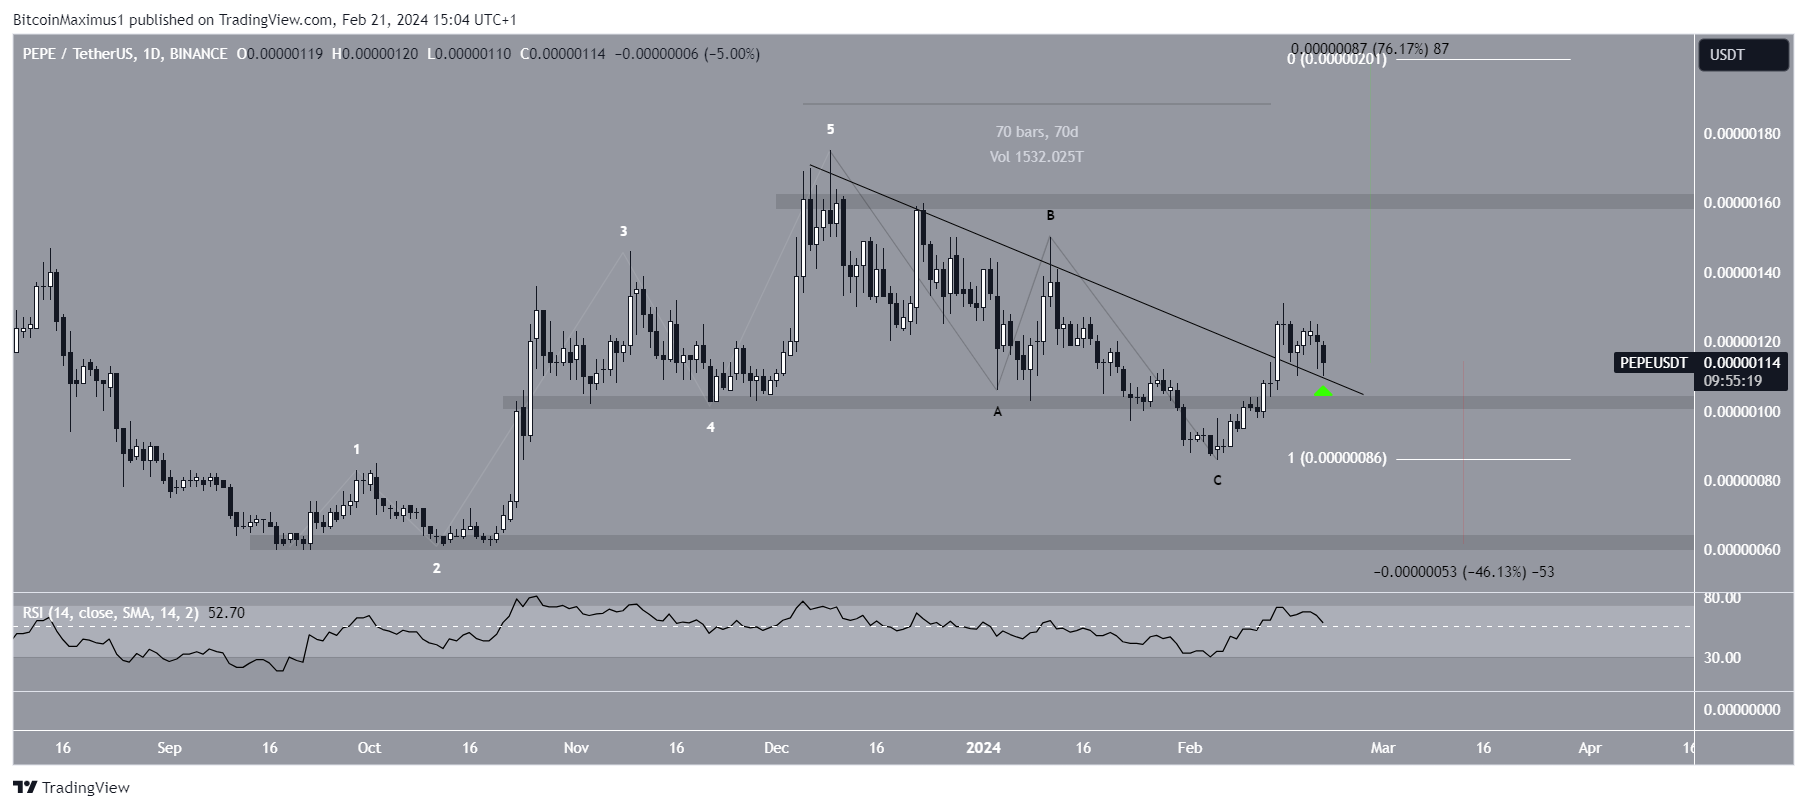
Despite the bullish PEPE price prediction, closing below the $0.0000011 horizontal area can trigger a 45% decrease to the closest support at $0.0000006.
Read More: What is PEPE and How Does it Work?
For BeInCrypto‘s latest crypto market analysis, click here.
![]()
PrimeXTB
PrimeXTB ” target=”_blank”>Explore →
![]()
Coinbase
Coinbase” target=”_blank”>Explore →
![]()
AlgosOne
AlgosOne” target=”_blank”>Explore →
![]()
UpHold
UpHold” target=”_blank”>Explore →
![]()
iTrustCapital
iTrustCapital” target=”_blank”> Explore →
Explore more
The post These 2 Meme Coins Defy Market Correction – Will They Lead the Next Cycle? appeared first on BeInCrypto.