BeInCrypto looks at five altcoins that increased the most in this week’s crypto market, specifically from September 1 to 8.
The term altcoin refers to cryptocurrencies other than Bitcoin (BTC). These bullish altcoins have stolen the crypto news and cryptocurrency market spotlight this week as the biggest gainers:
- Synthetix (SNX) price increased by 16.47%
- IOTA price increased by 14.74%
- Render (RNDR) price increased by 10.07%
- Stellar (XLM) price increased by 7.67%
- Astar (ASTR) price increased by 6.01%
SNX Price Leads Altcoin Gainers
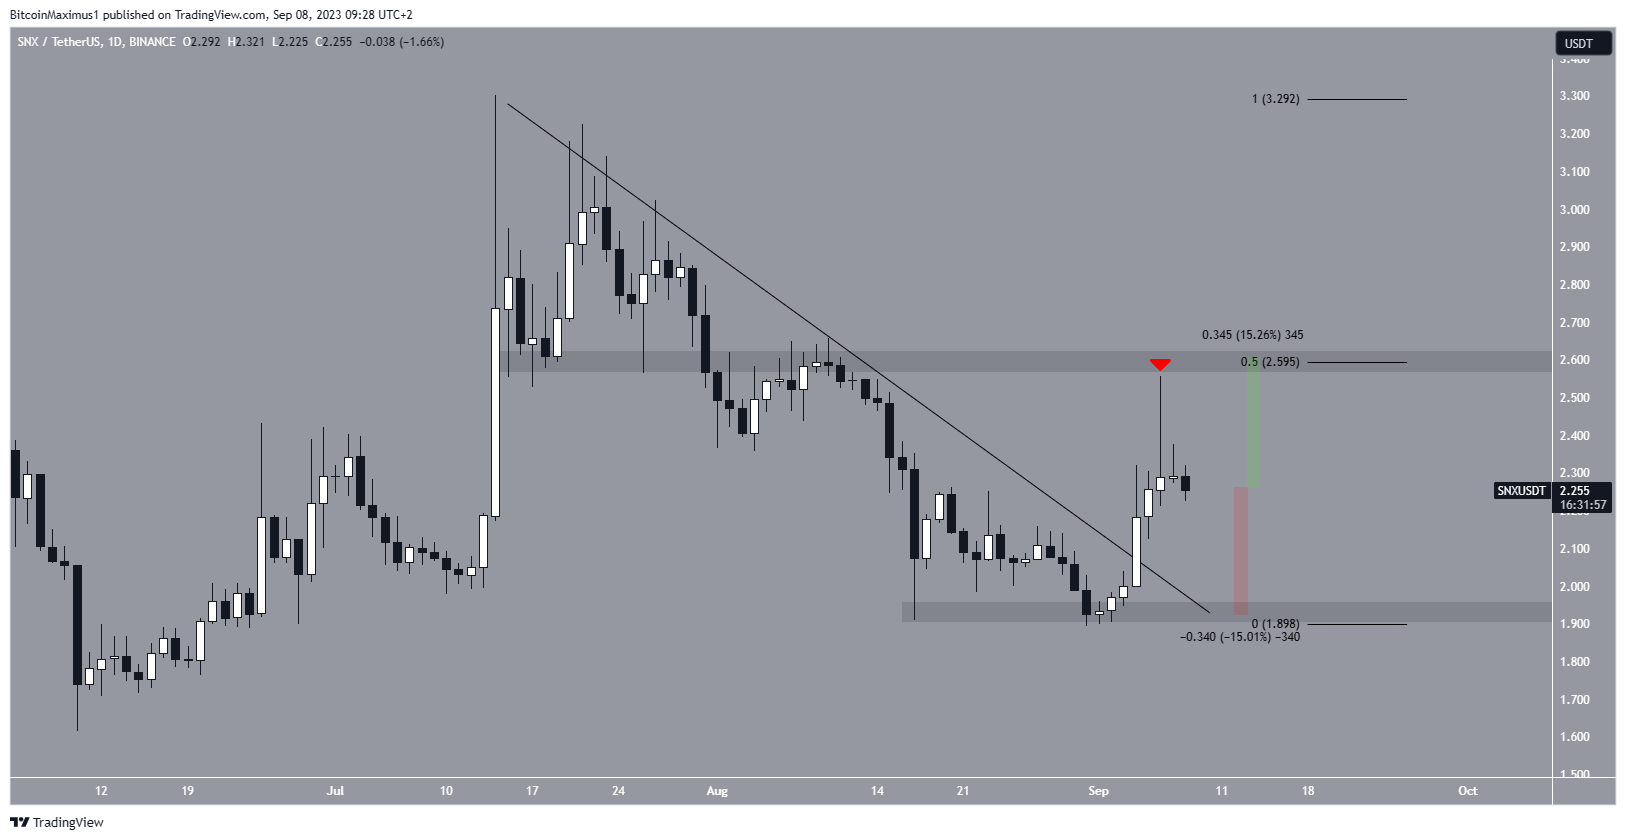
The SNX price has fallen under a descending resistance line since July 15. The decrease led to a low of $1.90 on August 31. However, the price bounced afterwards and broke out from the descending resistance line three days later.
After the breakout, the price reached a high of $2.56 on Sept. 6. The high was made slightly below the 0.5 Fib retracement resistance level at $2.60.
But, SNX fell shortly after the high and has fallen since, creating a long upper wick (red icon) in the process. The wick is considered a sign of selling pressure.
If the decrease continues, the closest support area will be at $1.95, a drop of 15% measuring from the current price. On the other hand, the closest resistance at $2.60 is 15% above the current price.
IOTA Price Bounces After Double Bottom
The IOTA price created a double bottom pattern on June 10 and Aug. 17 (green icons). The double bottom is considered a bullish pattern, meaning that it leads to breakouts most of the time.
After the second bottom, IOTA increased considerably, breaking out from a long-term descending resistance line on Sept. 5. This confirms the double bottom pattern and suggests that a new upward movement has begun.
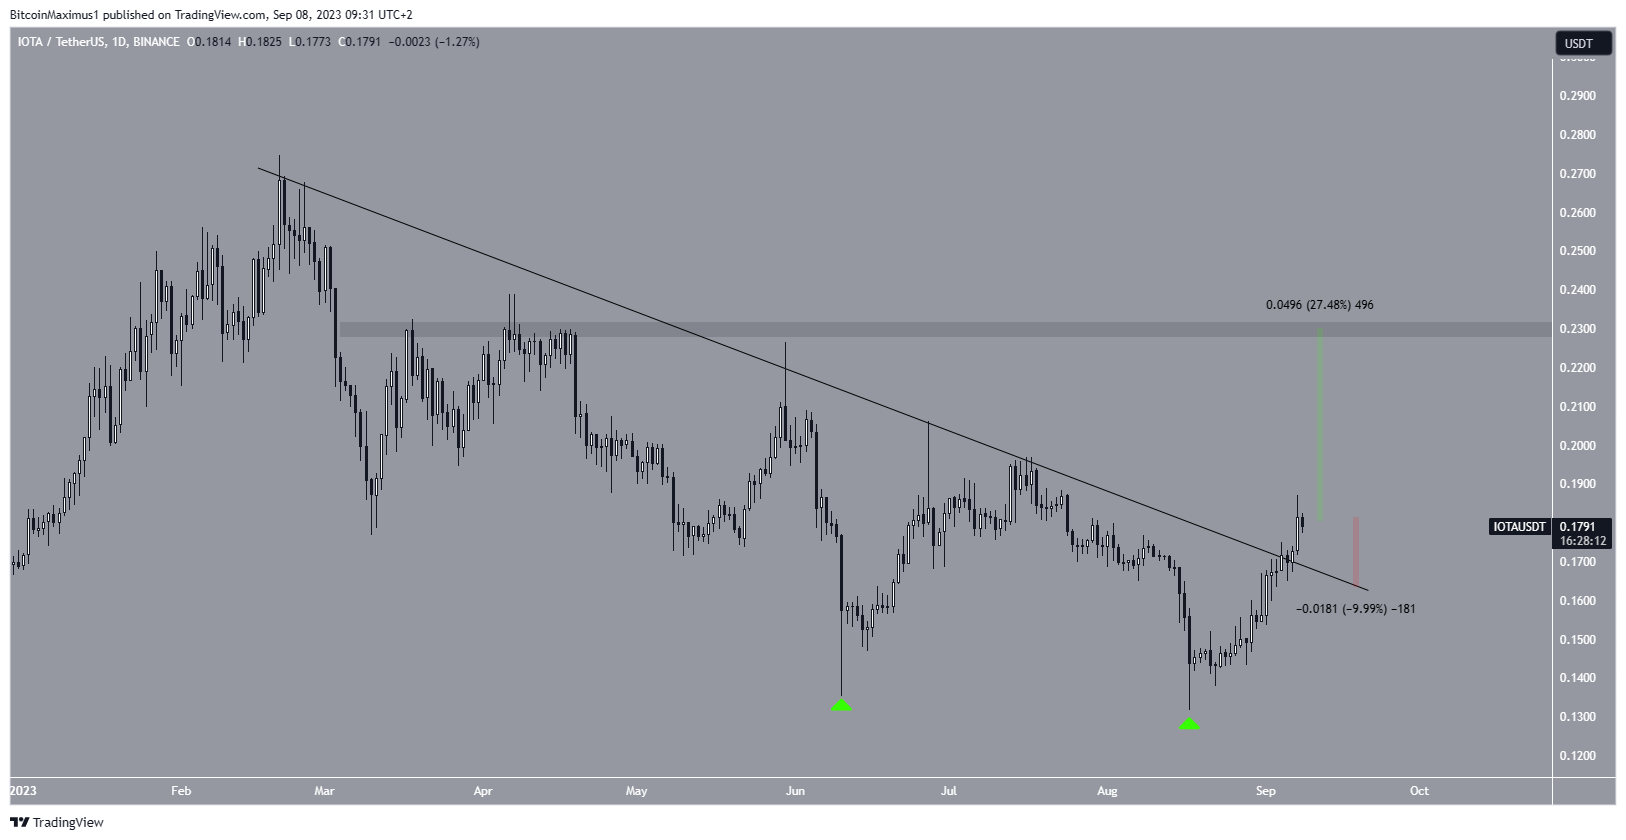
If the increase continues, the next closest resistance will be at $0.23, an increase of nearly 30% measuring from the current price. On the other hand, the price can fall to the resistance line near $0.16 if it loses momentum. This would amount to a drop of nearly 10%.
Read More: 11 Best Sites To Instantly Swap Crypto for the Lowest Fees
RNDR Breaks Out From Critical Resistance
The RNDR price has fallen below a descending resistance line since its yearly high of $2.95 on May 21. The downward movement led to a low of $1.25 on August 17.
However, the price bounced shortly afterwards, creating a long lower wick (green icon). After creating a higher low in the beginning of September, RNDR broke out from the resistance line on Sept. 7. Despite the breakout, the price has yet to initiate any sort of upward movement.
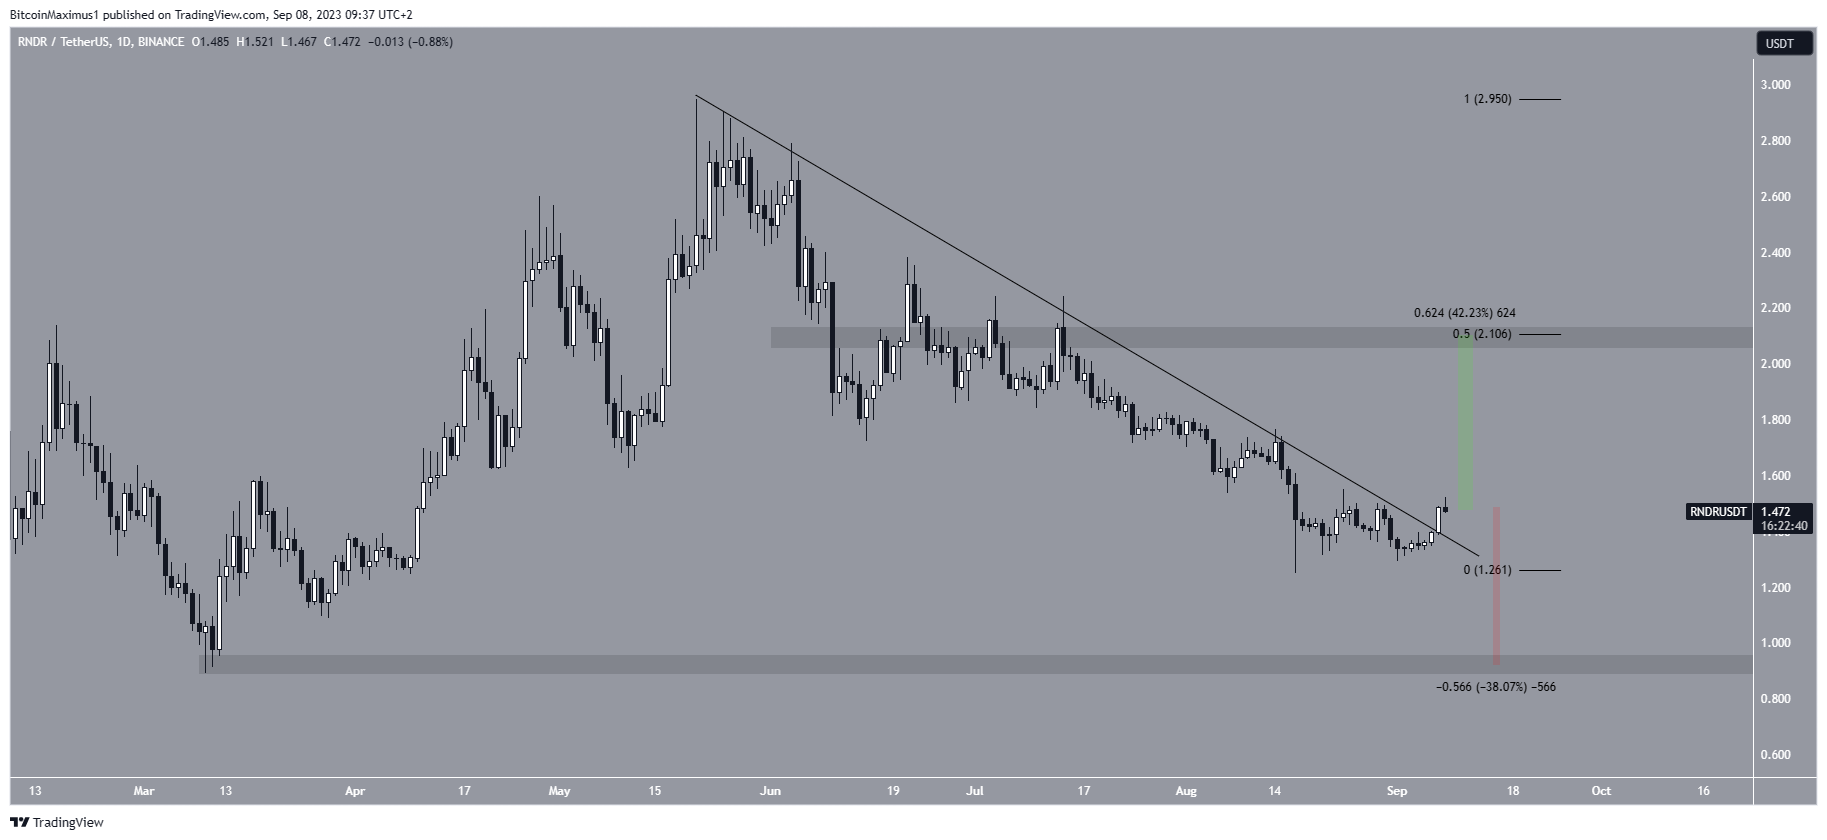
If RNDR begin to increase, the next resistance at $2.10 will be 40% above the current price. However, in case the breakout is illegitimate and the trend reverses, RNDR could drop to the next closest support at $0.90, a decrease of 40% measuring from the current price.
Looking For a New Exchange? These Are the Best Crypto Sign-Up Bonuses in 2023
Stellar (XLM) Price Attempts to Clear Resistance
The XLM price has increased since Aug. 17, when it bounced at the $0.11 horizontal support area. After creating a higher low, XLM broke out from the resistance line on Sept. 4. At the time of the breakout, the line had been in place for 52 days.
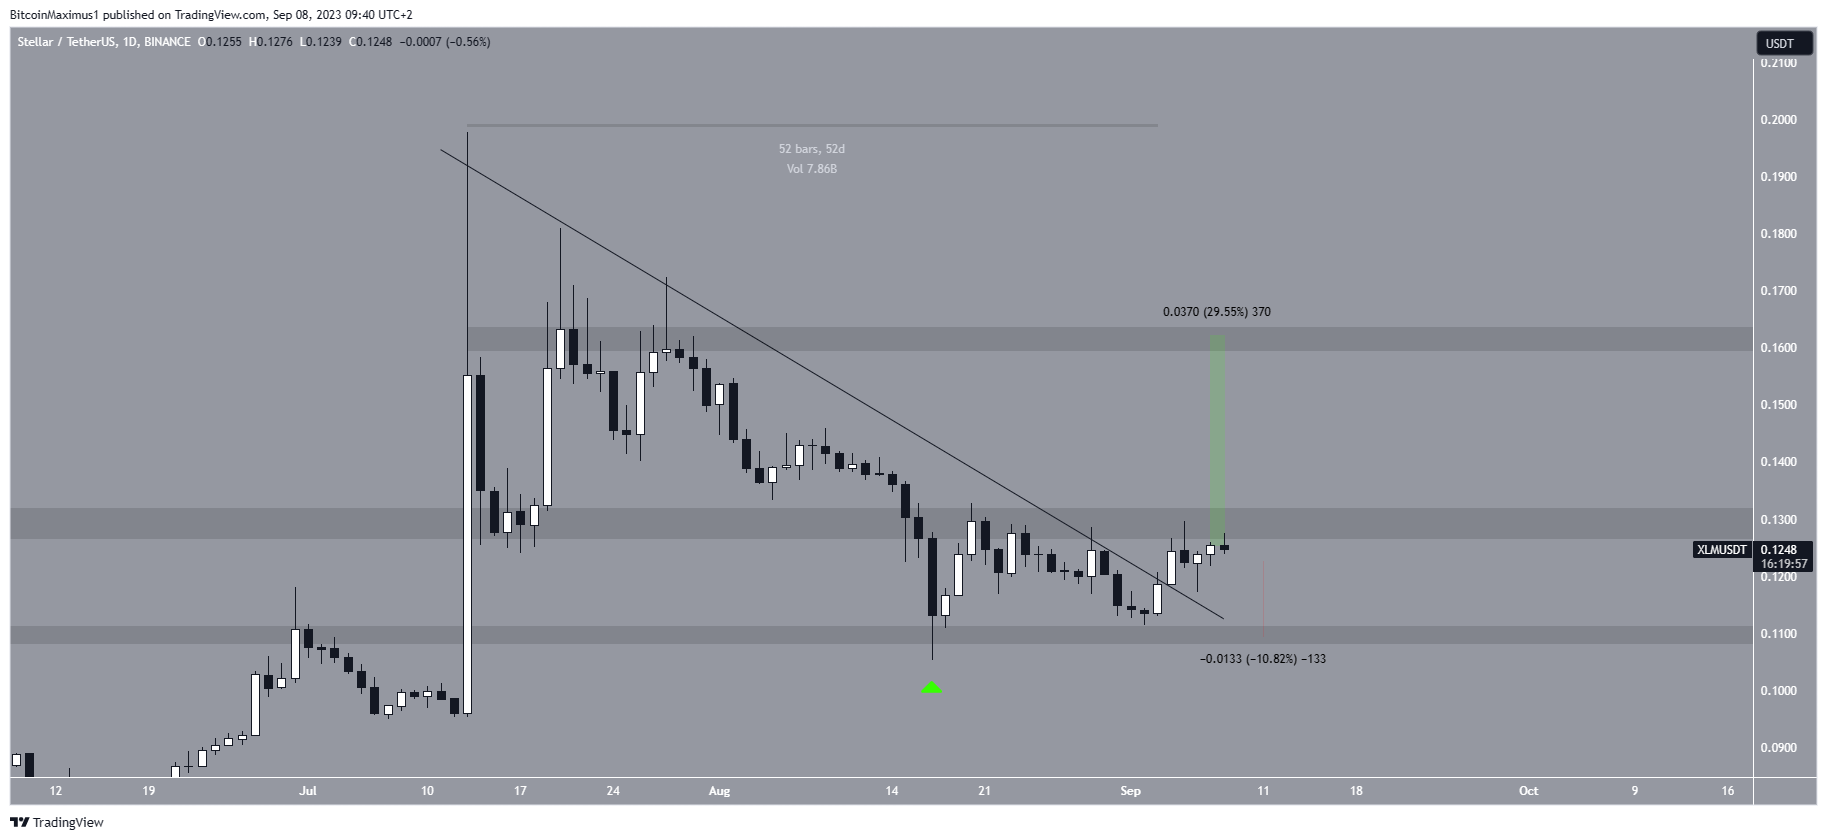
Currently, XLM is attempting to clear the $0.13 horizontal resistance area. If it is successful, a 30% increase to the $0.16 resistance will be expected. On the other hand, a 10% drop to the $0.11 support area will likely occur if the price gets rejected again.
Astar (ASTR) Price Concludes Altcoin Gainers
The ASTR price has increased alongside an ascending support line since June 10. The line has been validated numerous times, more recently on Sept. 5 (green icon). The price has increased since the final bounce.
Despite the upward movement, ASTR still trades below the $0.060 horizontal resistance area. This is a crucial level since it has intermittently provided both resistance and support for nearly a month.
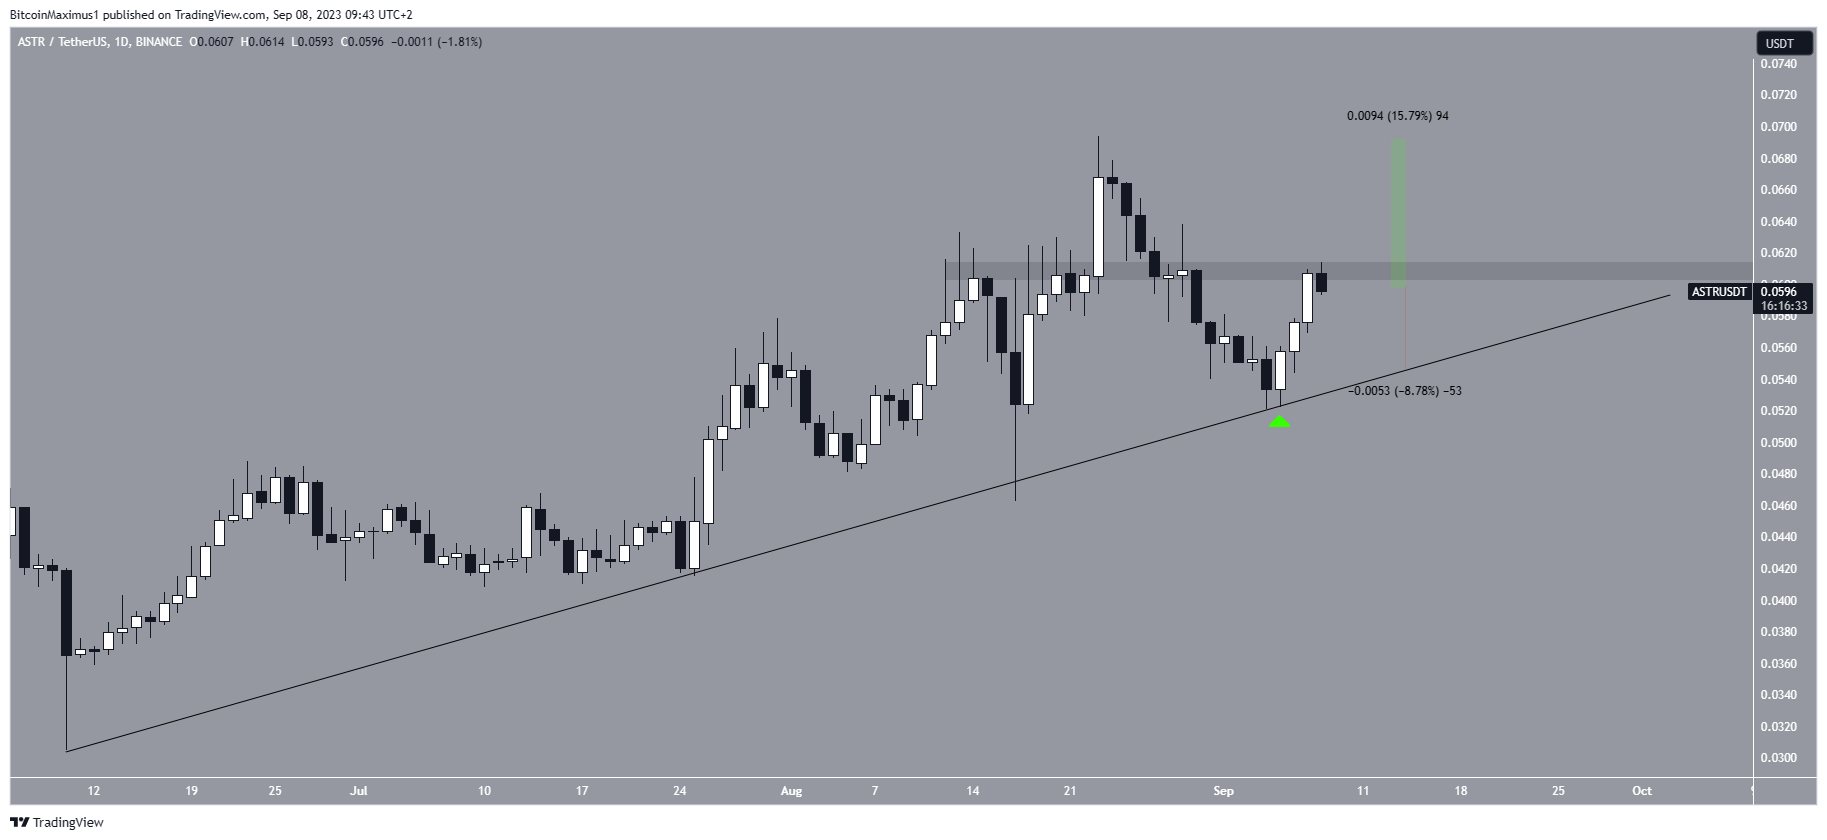
If ASTR breaks out, it can reach the next resistance at $0.070, an increase of 15%. On the other hand, a rejection can lead to a 9% drop to the ascending support line which is currently at $0.054.
Read More: 9 Best AI Crypto Trading Bots to Maximize Your Profits
For BeInCrypto’s latest crypto market analysis, click here.
The post These Altcoins Saw the Biggest Gains in Price This Week appeared first on BeInCrypto.
